A few years ago the news magazine The Economist listed some of the stranger explanations used in the past to predict presidential election outcomes.
These included whether or not the hemlines of women's skirts went up or down, stock market performances, baseball World Series wins by an American League team, etc. Thinking about this problem more seriously, you decide to analyze whether or not the presidential candidate for a certain party did better if his party controlled the house. Accordingly you collect data for the last 34 presidential elections. You think of this data as comprising a population which you want to describe, rather than a sample from which you want to infer behavior of a larger population. You generate the accompanying table:
Joint Distribution of Presidential Party Affiliation and Party Control
of House of Representatives, 1860-1996
Democratic Control of House (Y = 0) Republican Control of House (Y = 1) Total
Democratic President (X = 0) 0.412 0.030 0.441
Republican President (X = 1) 0.176 0.382 0.559
Total 0.588 0.412 1.00
(a) Interpret one of the joint probabilities and one of the marginal probabilities.
(b) Compute E(X). How does this differ from E(X = 0)? Explain.
(c) If you picked one of the Republican presidents at random, what is the probability that during his term the Democrats had control of the House?
(d) What would the joint distribution look like under independence? Check your results by calculating the two conditional distributions and compare these to the marginal distribution.
What will be an ideal response?
Question 2
Calculate the following probabilities using the standard normal distribution. Sketch the probability distribution in each case, shading in the area of the calculated probability.
(a) Pr(Z < 0.0)
(b) Pr(Z 1.0)
(c) Pr(Z > 1.96)
(d) Pr(Z < 2.0)
(e) Pr(Z > 1.645)
(f) Pr(Z > 1.645)
(g) Pr(1.96 < Z < 1.96)
(h.) Pr(Z < 2.576 or Z > 2.576)
(i.) Pr(Z > z) = 0.10; find z.
(j.) Pr(Z < z or Z > z) = 0.05; find z.
What will be an ideal response?

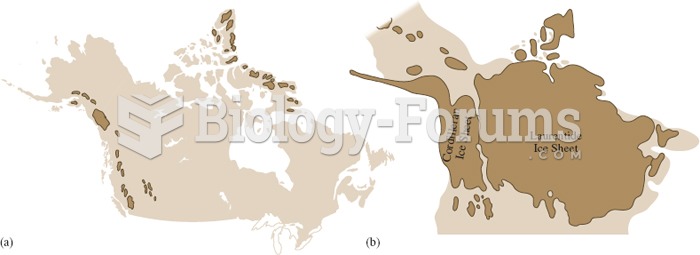 Distribution of glaciers in North America (a) in the late twentieth century, and (b) 18,000 years ag
 In 2008, the U.S. economy suffered a gaping wound as several trillion dollars were ripped out of it.
 School age (late childhood): 6–12 years, or to puberty.
 The age-related increase in spirituality is different for two cohorts born seven years apart. The ...
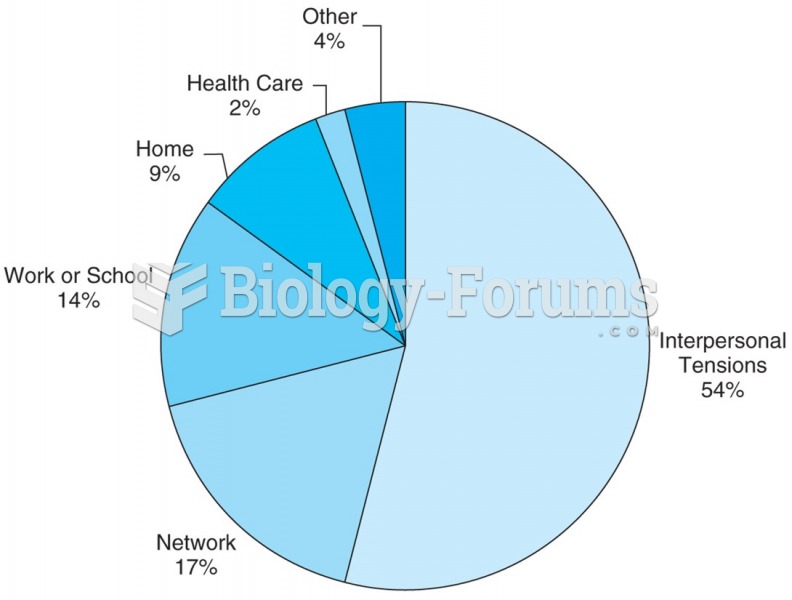 U.S. adults from 25 to 74 years report that the largest proportion of their daily stressors arise ...
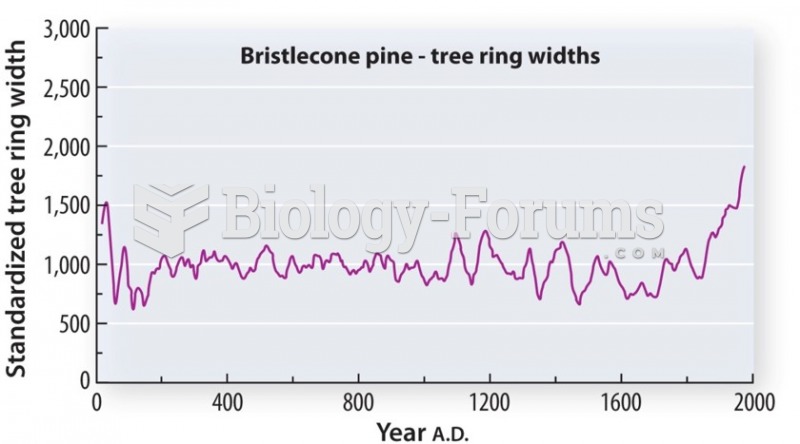 An overlapping record extends back thousands of years of tree ring width