The t-statistic has the following distribution:
A) standard normal distribution for n < 15
B) Student t distribution with n1 degrees of freedom regardless of the distribution of the Y.
C) Student t distribution with n1 degrees of freedom if the Y is normally distributed.
D) a standard normal distribution if the sample standard deviation goes to zero.
Question 2
You have read about the so-called catch-up theory by economic historians, whereby nations that are further behind in per capita income grow faster subsequently. If this is true systematically, then eventually laggards will reach the leader.
To put the theory to the test, you collect data on relative (to the United States) per capita income for two years, 1960 and 1990, for 24 OECD countries. You think of these countries as a population you want to describe, rather than a sample from which you want to infer behavior of a larger population. The relevant data for this question is as follows:
where X1 and X2 are per capita income relative to the United States in 1960 and 1990 respectively, and Y is the average annual growth rate in X over the 1960-1990 period. Numbers in the last row represent sums of the columns above.
(a) Calculate the variance and standard deviation of X1 and X2. For a catch-up effect to be present, what relationship must the two standard deviations show? Is this the case here?
(b) Calculate the correlation between Y and . What sign must the correlation coefficient have for there to be evidence of a catch-up effect? Explain.
What will be an ideal response?

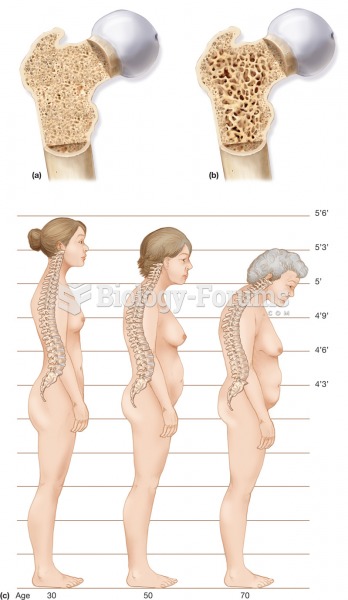 Osteoporosis. (a) A section through normal spongy bone. (b) A section through a bone with osteoporos
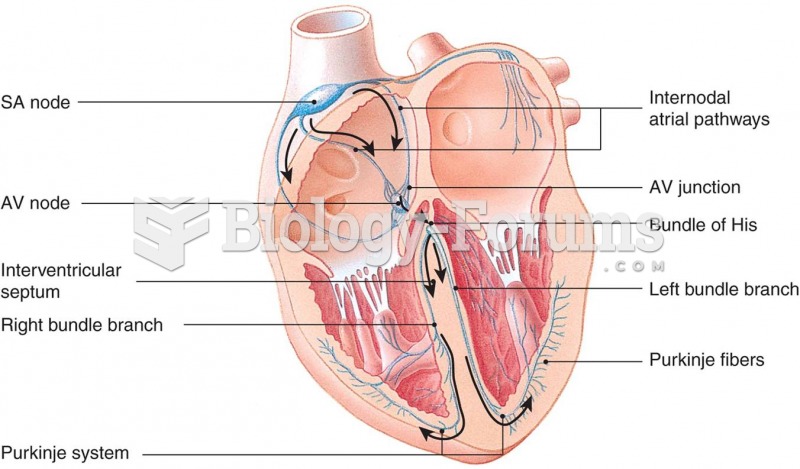 Normal conduction pathway in the heart
 Geographic distribution of early hominins.
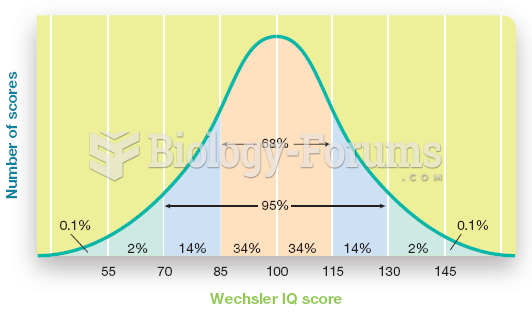 The Normal Distribution of Scores for a Standardized Intelligence Test
 A weather map depicting the sea-level pressure distribution for March 4, 1994.
 Distribution of dystrophin in muscle cells. (a) In normal muscle cells, all the dystrophin is locate