Refer to the above figure. The market equilibrium quantity is Q1. Point Q2 represents the optimal amount of production. This indicates that there is
A) a public good which should be produced.
B) regressive taxation of the product.
C) a positive externality.
D) a negative externality.
Question 2
When supply and demand for a product increase simultaneously, we
A) can predict that both the market clearing price and the equilibrium quantity will increase.
B) can predict that both the market clearing price and the equilibrium quantity will decrease.
C) cannot predict the market clearing price, but know that the equilibrium quantity will increase.
D) cannot predict the change in either the equilibrium quantity or the market clearing price.

 All of the homes in this new neighborhood of Brentwood, California, are for sale, evidence of the co
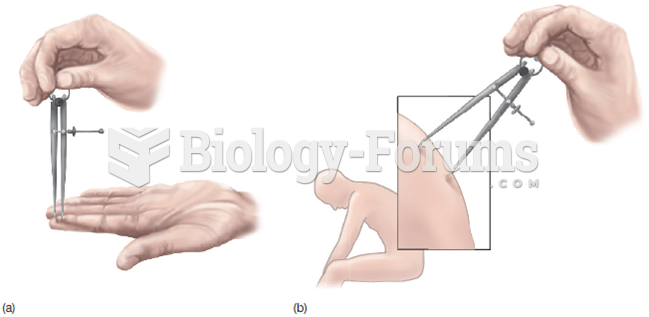 Two-Point Threshold Device for Measuring Touch Acuity
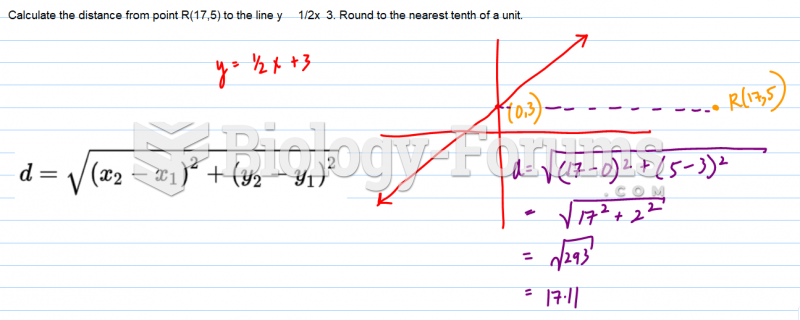 Calculate the distance from point R(17,5) to the line ... Round to the nearest tenth of a
 Chloroform has a boiling point of 61.1 degrees C and dichloromethane has a boiling point of 40 ...
 Write equilibrium constant expressions for the following reactions in terms of concentration:
 Constructing a Three-Point Recombination Map