Answer to Question 1
B
Answer to Question 2
The movement from A to B to C illustrates diminishing returns to capital in the diagram. When technology is held constant, equal increases in capital per hour lead to diminishing increases in output per hour. Technology is held constant by moving along a given production function diagram. Capital per hour increases by 10,000 per worker in the movement from A to B and from B to C. The movement from A to B increases output per worker by 1,000. The movement from B to C increases output per worker by 400. Clearly, the additions to output are diminishing.

 Periodic Table
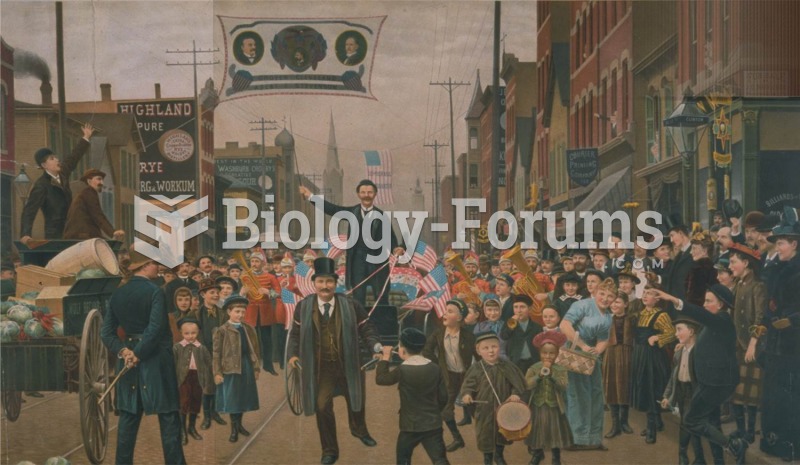 A parade for Grover Cleveland in Chicago in 1892, by John Klir. Music, mirth, real drama—a president
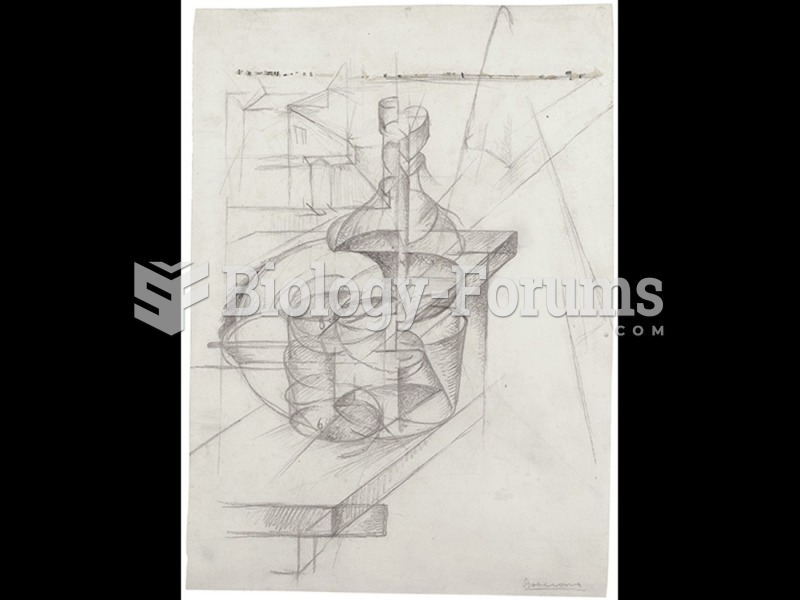 Umberto Boccioni, Table + Bottle + House.
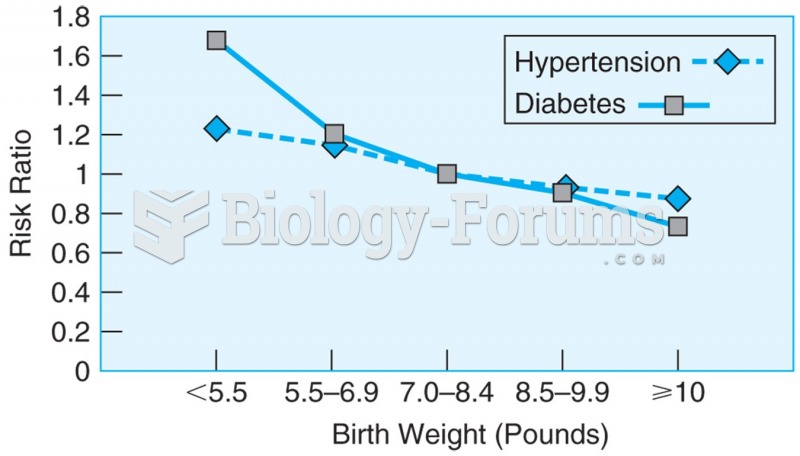 Data from more than 22,000 men over the age of 40, showing the relationship between birth weight and ...
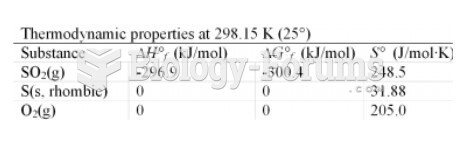 table
table
 Hardy–Weinberg Mating Table for Two Alleles of an Autosomal Gene