This topic contains a solution. Click here to go to the answer
|
|
|

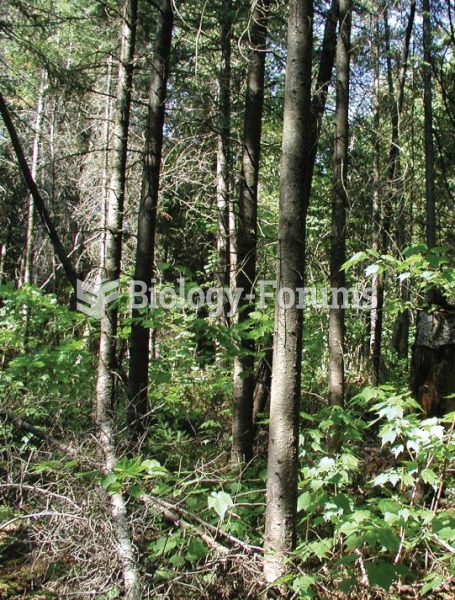 Changes in boreal forest composition along a chronosequence in Quebec. Dates refer to the year of th
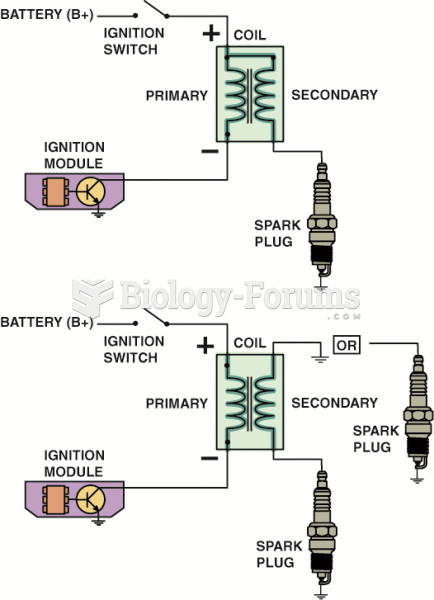 Some ignition coils are electrically connected, called married (top figure), whereas others use ...
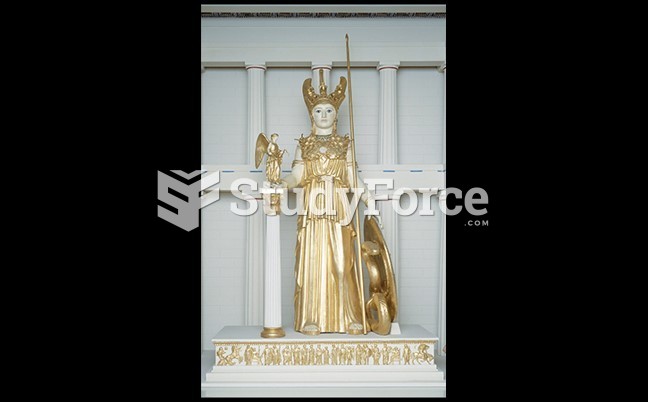 Re-creation of Pheidias’s Huge Gold and Ivory Figure of Athena
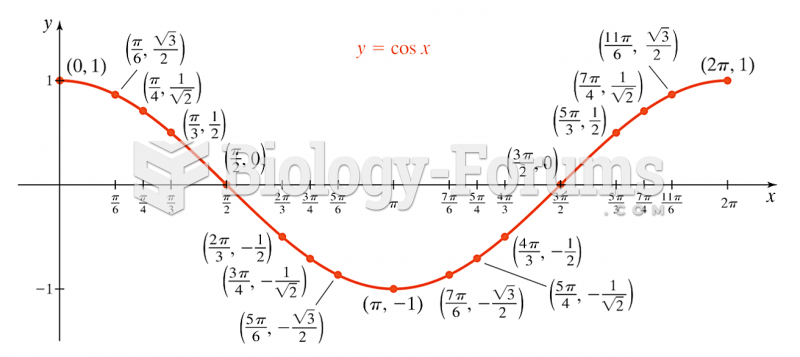 Graph of cos(x)
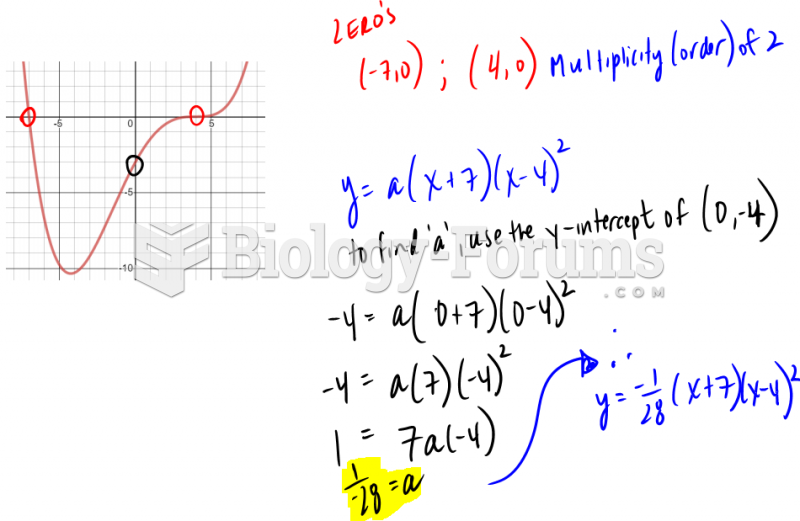 Converting cubic graph to function
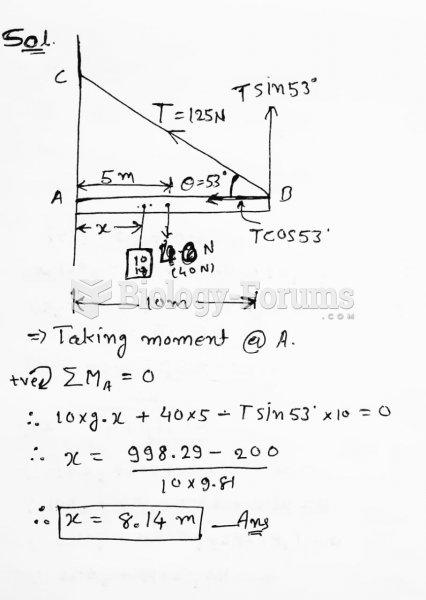 In the figure, a 10.0-m long bar is attached by a frictionless hinge to a wall and held ...