This topic contains a solution. Click here to go to the answer
|
|
|

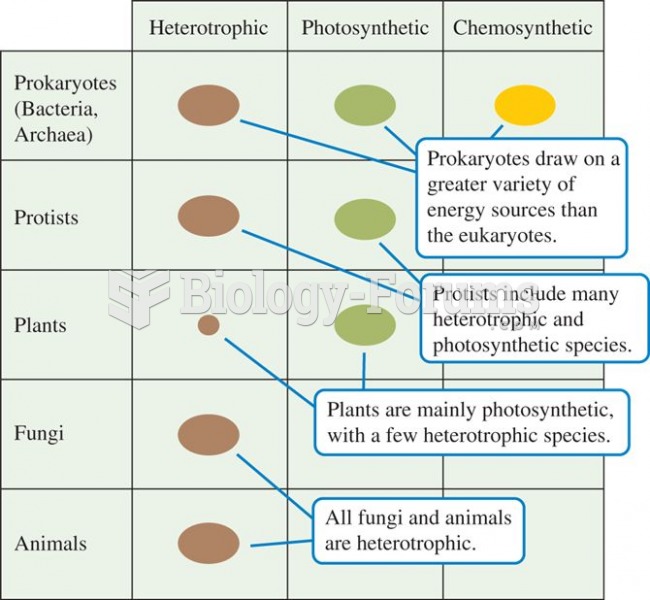 A plot of trophic diversity across the major groups of organisms shows highest trophic diversity amo
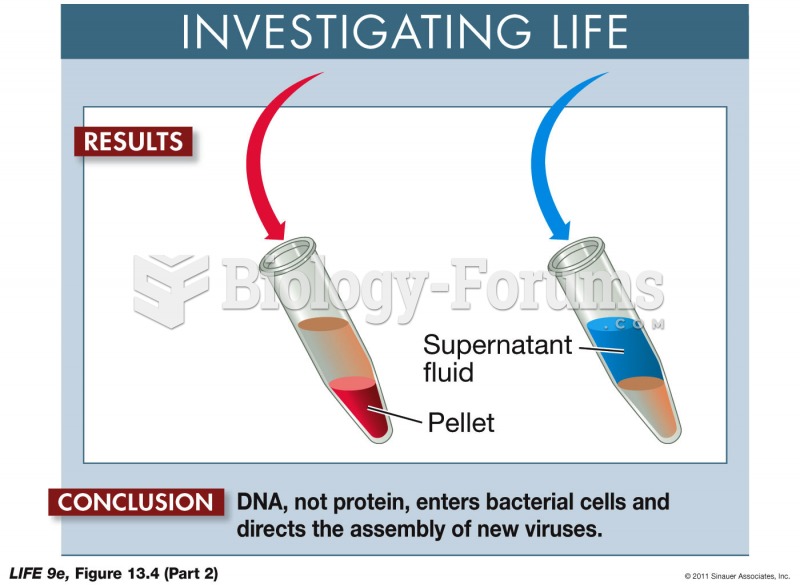 The Hershey-Chase Experiment p2
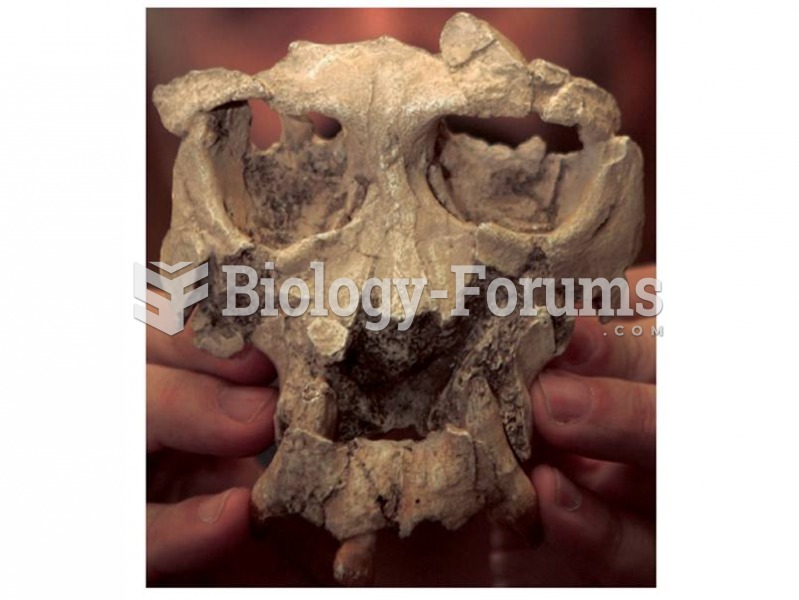 Pierolapithecus catalunicus may be an ancestor of great apes and humans. Its postcranial skeleton sh
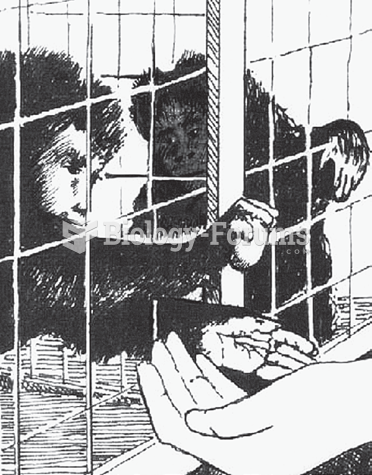 Monkey Experiment: Sense of Fairness
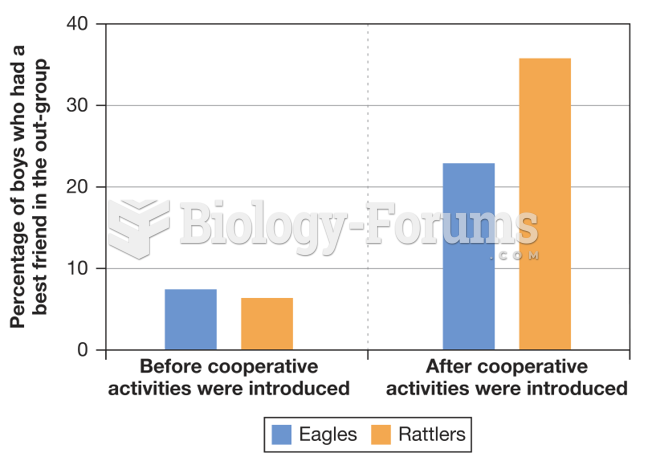 The Experiment at Robbers Cave
 A melting profile shows the increase in UV absorption versus temperature