This topic contains a solution. Click here to go to the answer
|
|
|

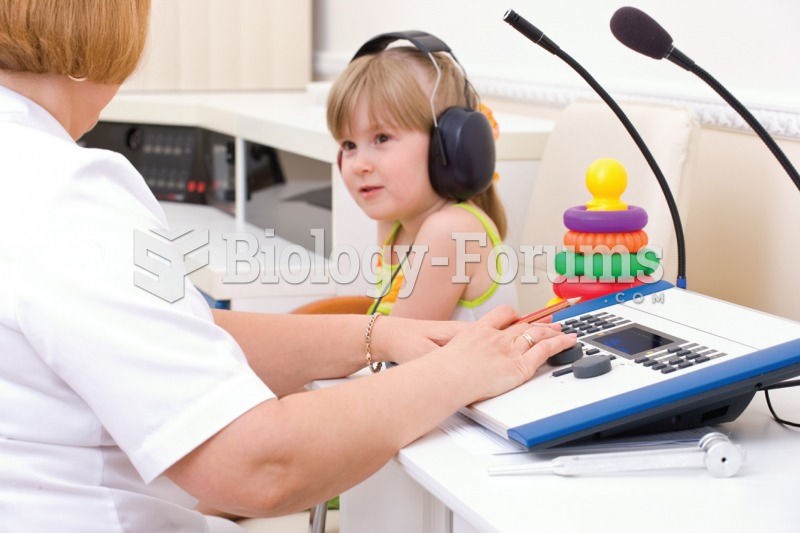 Audiometry. The child in this photograph is undergoing a hearing test with an audiologist.
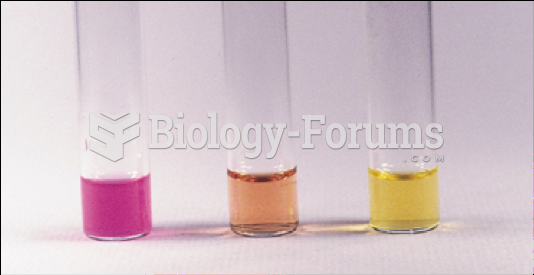 Urease Test
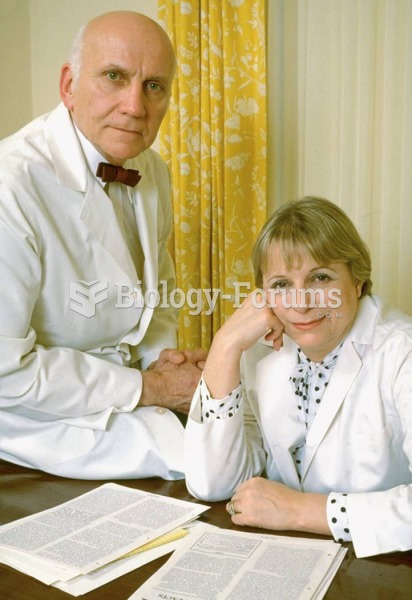 William Masters and Virginia Johnson are among the most influential researchers in the history of th
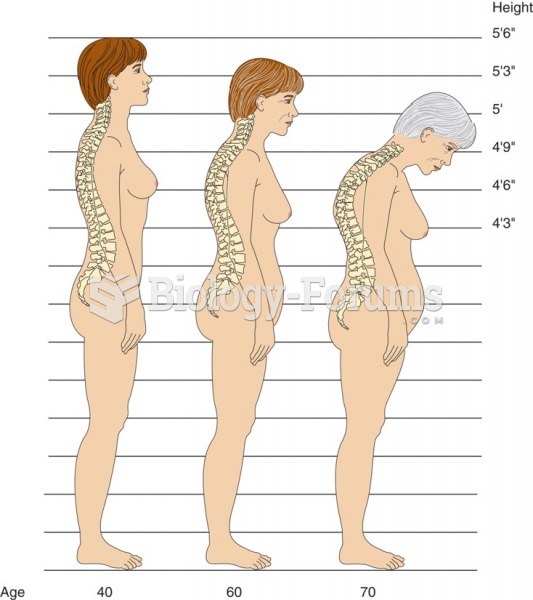 Spinal changes caused by osteoporosis.
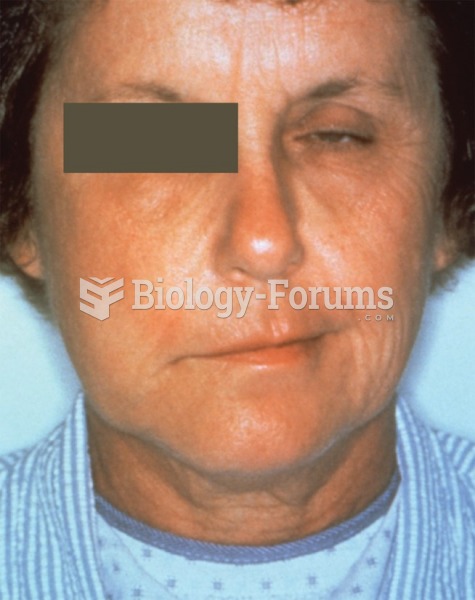 This patient presented with a case of facial palsy caused by an infection by the bacterial ...
 How to evaluate angles using cosecant, special triangles, and the unit circle (Part 3)