The increase in the demand for widgets, shown in the figure above, is the result of an increase in people's incomes from 28,500 per year to 31,500 per year. Therefore, the income elasticity of demand for widgets is
A) 0.25.
B) 0.75.
C) 1.33.
D) 4.00.
Question 2
The figure above shows Sam's budget line. Which of the following would result in Sam's budget line rotating outward and not changing its horizontal intercept?
A) a fall in the price of a pound of coffee
B) a rise in the price of a pound of coffee
C) a fall in the price of a gallon of gasoline
D) a rise in the price of a gallon of gasoline

 Browning and Gunning demonstrated that placental transfer tissues increase plant reproductive succes
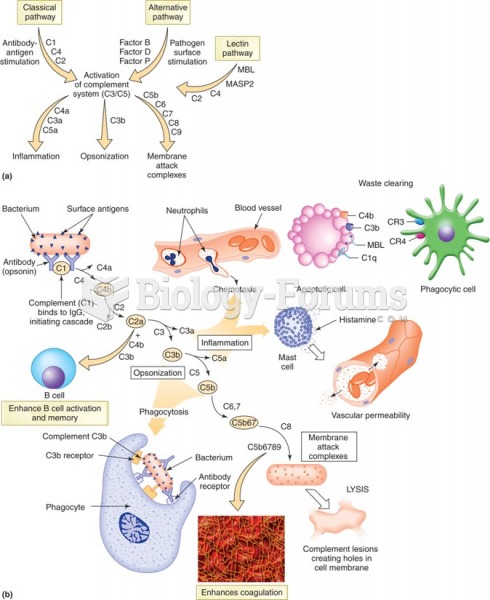 Three pathways of complement combined. (a) Figure shows a summary of how each pathway proceeds. (b) ...
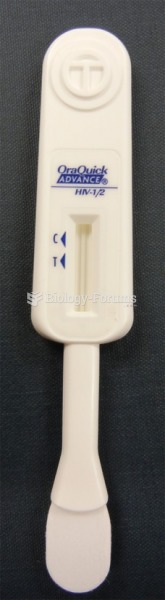 OraQuick. A negative result would show a red line at the "C" mark, whereas a positive ...
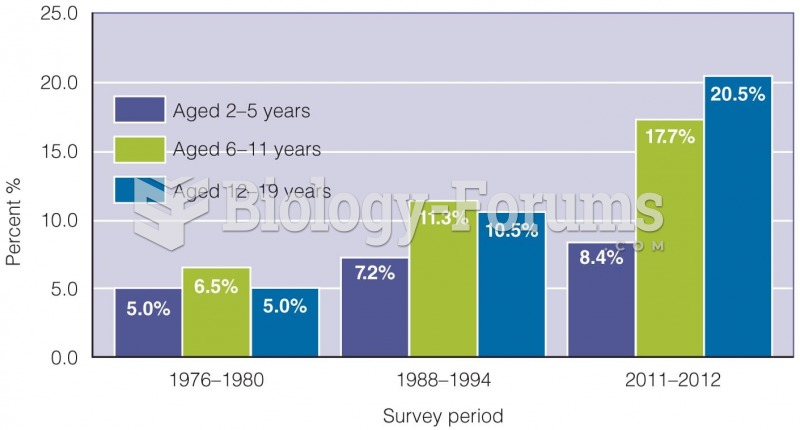 Increase in Obesity among U.S. Children and Adolescents
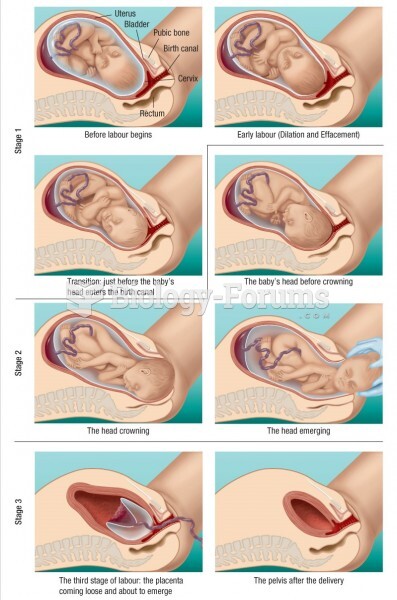 The sequence of steps during delivery is shown clearly in these drawings