This topic contains a solution. Click here to go to the answer
|
|
|

 Differences in the number and location of flagella.
 Biology class derp
 A miner greets the president. Franklin’s “first-class temperament” compensated for his ...
 Weber's Three Components Of Social Class
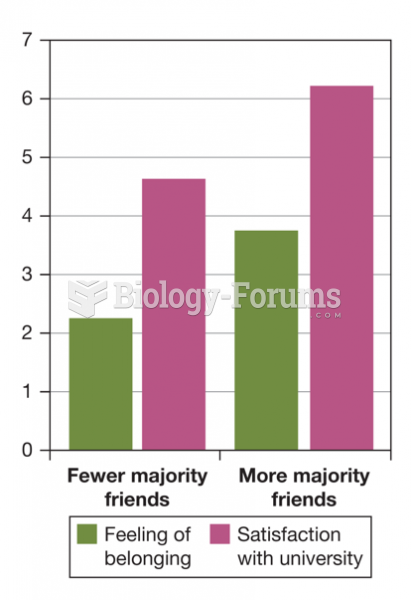 The Impact of Cross-Ethnic Friendships on Minority Students’ Well-Being
 How would you write the number 120 in Babylonian?