In the above figure, the economy is at point A when changes occur. If the new equilibrium has a price level of 100 and real GDP of 17.0 trillion, then it must be the case that
A) aggregate demand has decreased.
B) aggregate supply has decreased.
C) aggregate demand has increased.
D) aggregate supply has increased.
Question 2
Using the data in the above table, suppose imports equal 250 billion and investment equals 1,000 billion. Hence government expenditure equals
A) 1,000 billion.
B) 750 billion.
C) 500 billion.
D) 250 billion.

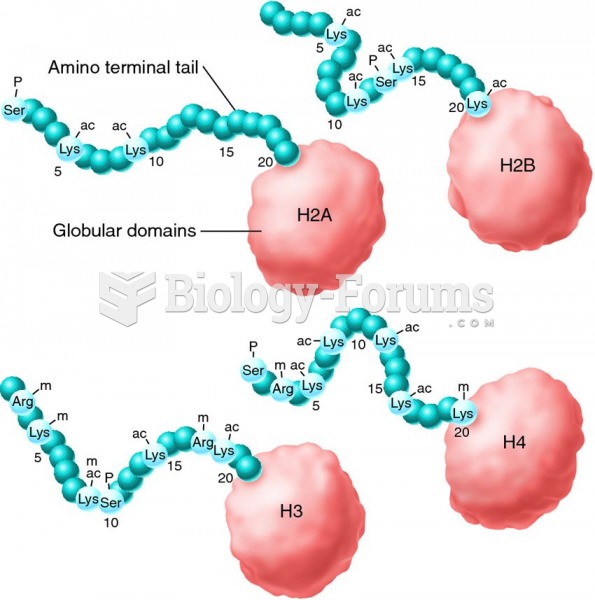 Examples of covalent modifications that occur to the amino terminal tails of histone proteins. The a
 Ulysses S. Grant poses at City Point, Virginia, during the siege of Petersburg.
 POWER POINT PRESENTATION logo
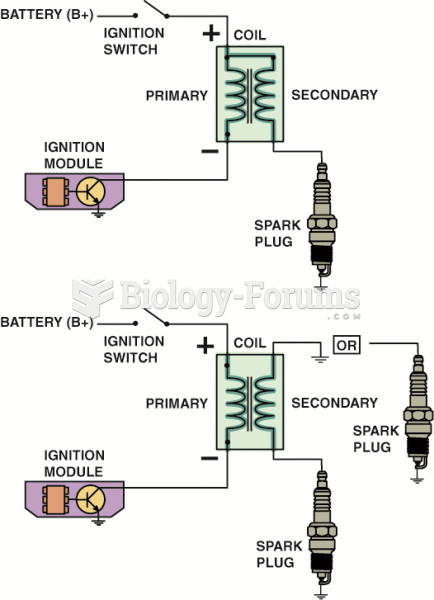 Some ignition coils are electrically connected, called married (top figure), whereas others use ...
 Waterspouts are tornadoes that occur over warm-water bodies, instead of over land.
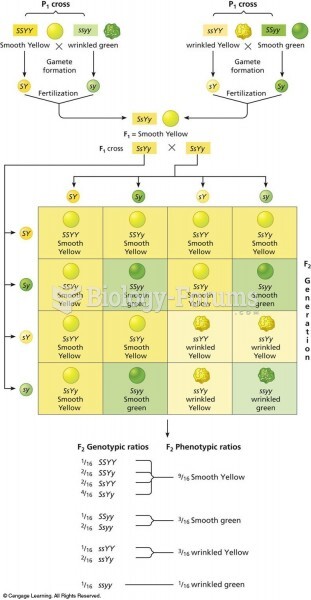 Punnett square of the dihybrid cross shown in Figure 3.8. There are two combinations of dominant and