This topic contains a solution. Click here to go to the answer
|
|
|

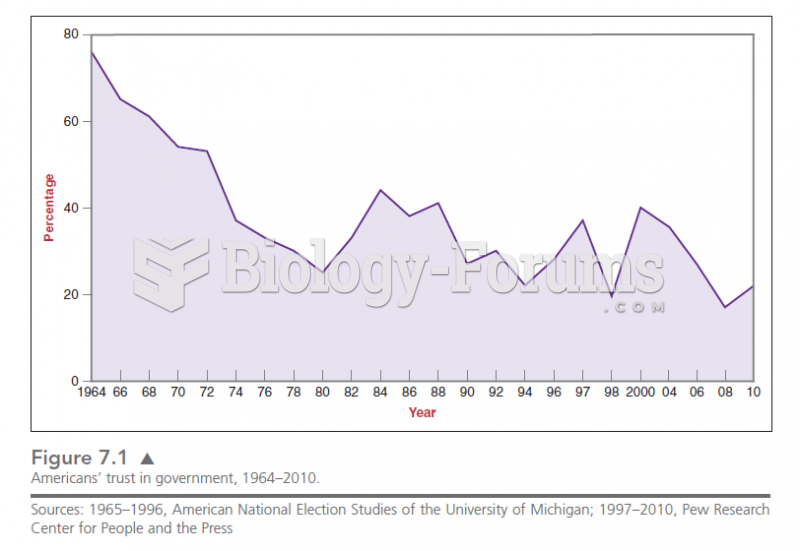 Figure 7.1 shows the rapid decline in the trust of Americans in government since the 1960s. This de
 Many households today include young adults who have not moved out of their parents’ homes (or who ...
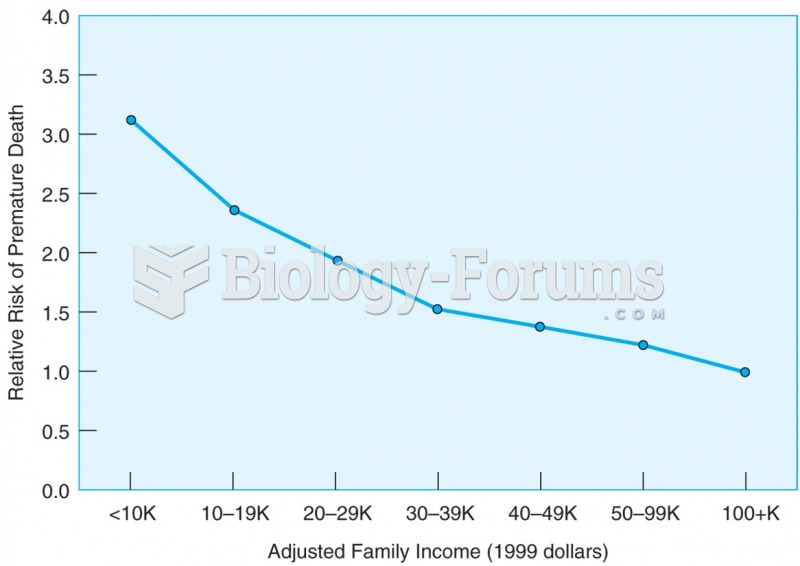 The risk of dying before the age of 65 gets lower as family income gets higher.
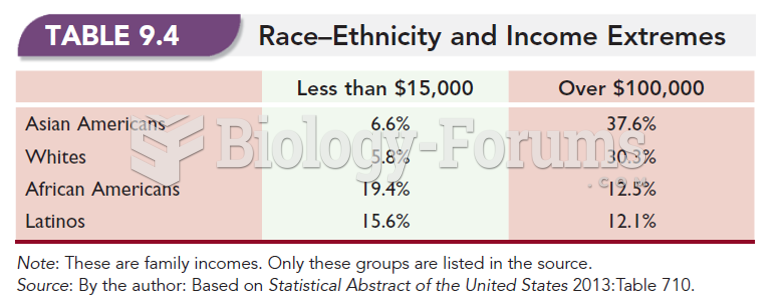 Race-Ethnicity and Income Extremes
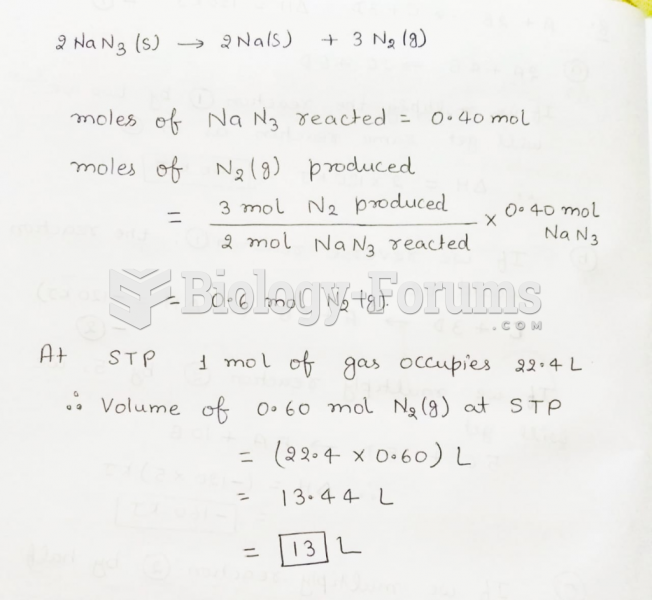 If 0.40 mol of NaN3 reacts completely in the reaction shown below, then ________ L of N2 will ...
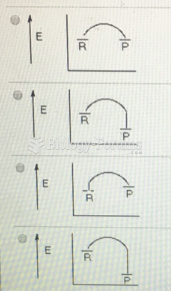 Which of the following represents a reaction coordinate diagram for a chemical reaction whose ...