This topic contains a solution. Click here to go to the answer
|
|
|

 An example of a Hertzsprung–Russell diagram for a set of stars that includes the Sun
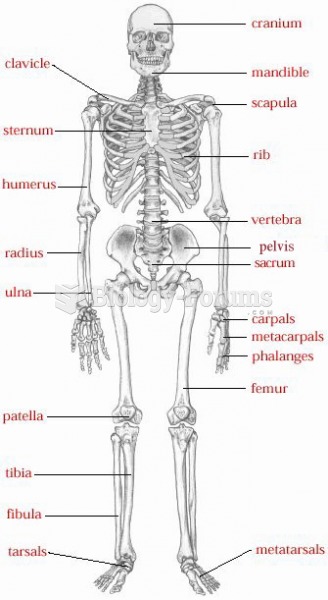 Skeleton Diagram
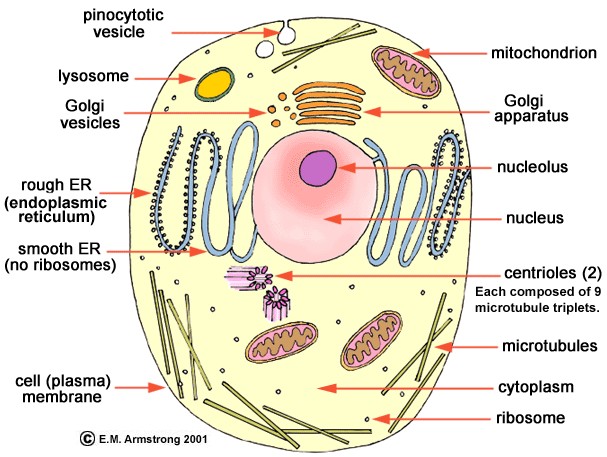 bacteria cell diagram
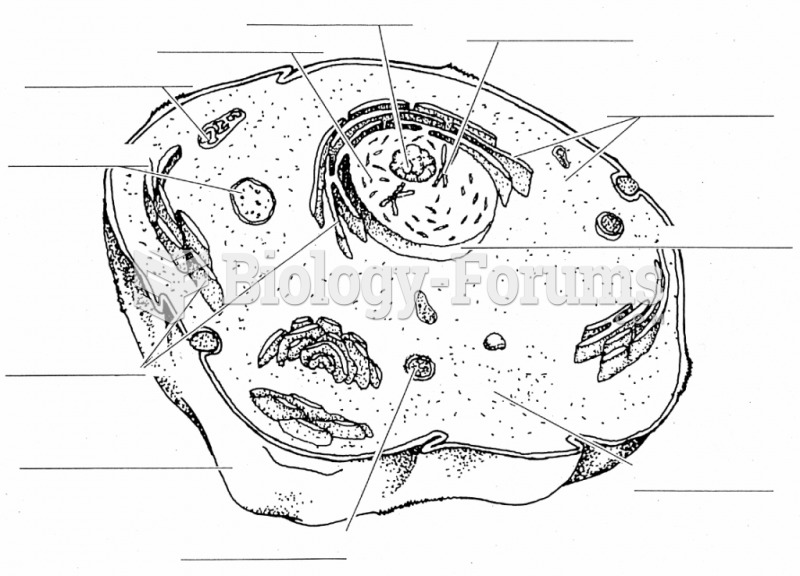 Blank cell diagram
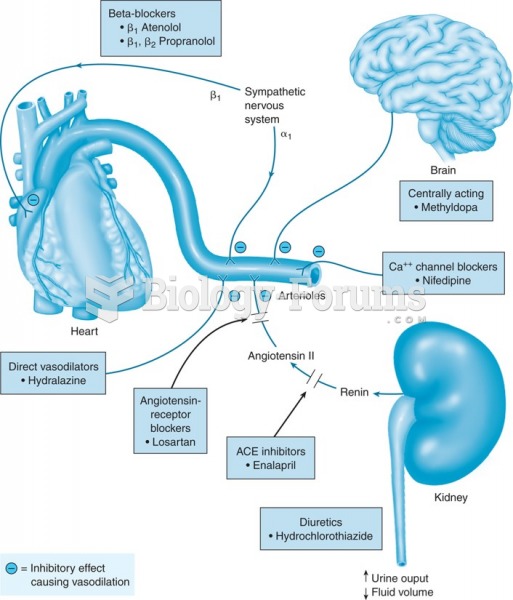 Diagram showing the sites of action of different antihypertensive drugs.
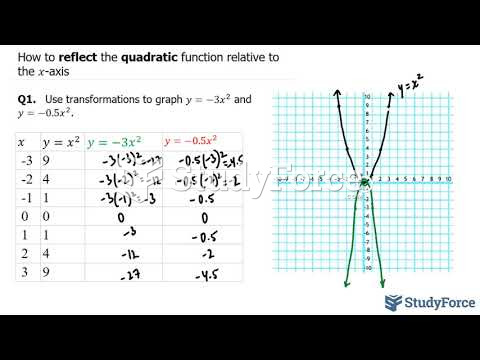 How to reflect the quadratic function relative to the x-axis