Refer to the figure above. The region BAH represents the ________.
A) consumer surplus after taxation
B) tax incidence on consumers
C) tax incidence on producers
D) deadweight loss due to taxation
Question 2
By itself, a supply shock, such as a hike in the price of oil, can
A) cause real GDP to permanently decrease year after year.
B) not result in persisting inflation.
C) be inflationary as long as there is no policy response.
D) result in persisting inflation if aggregate supply persistently increases.
E) result in a persisting wage-price spiral.

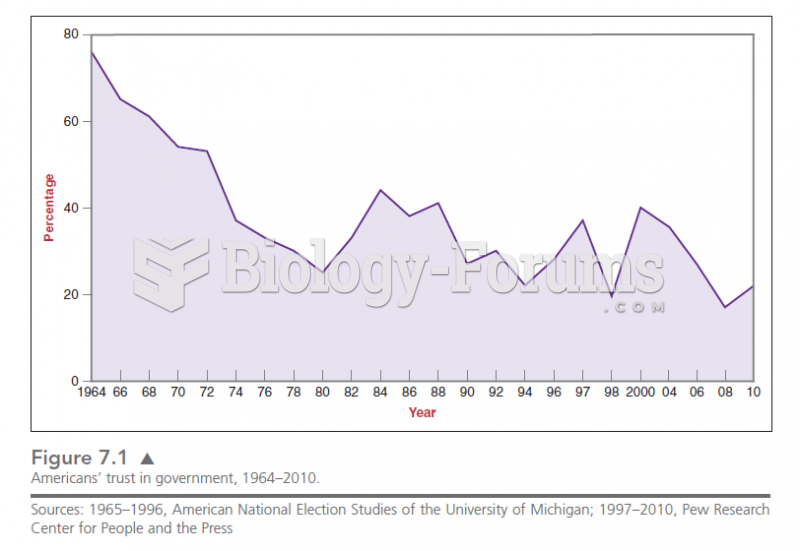 Figure 7.1 shows the rapid decline in the trust of Americans in government since the 1960s. This de
 Historian James Merrell notes several errors in Benjamin West’s famous 1771 painting, William Penn’s
 James Madison was a key figure at the Constitutional Convention of 1787 in Philadelphia. He not only
 Demonstrate the Application of Triangular, Figure-Eight, and Tubular Bandages
 Mobilize the joints in the hand. Follow with figure-8s at the knuckles and scissoring the ...
 Refer to Scenario 3.1. If the price of potato chips is $0.50 and the price of Cola is $4.00, ...