|
|
|

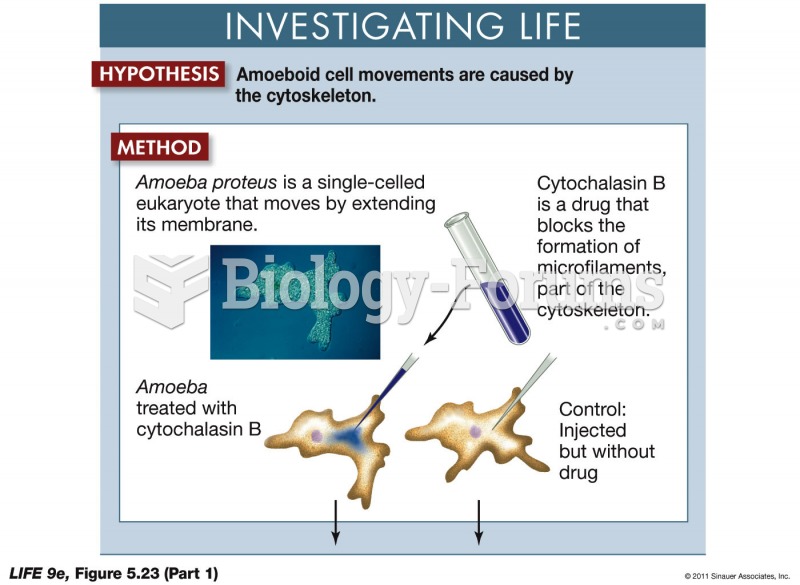 The Role of Microfilaments in Cell Movement-Showing Cause and Effect in Biology 1
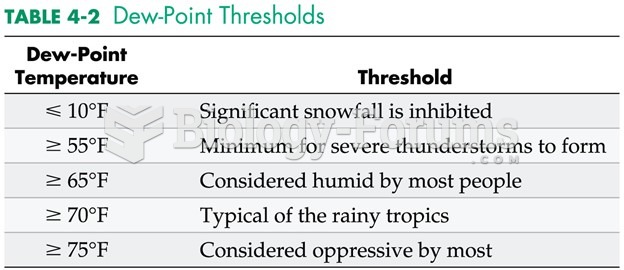 Dew-Point Thresholds
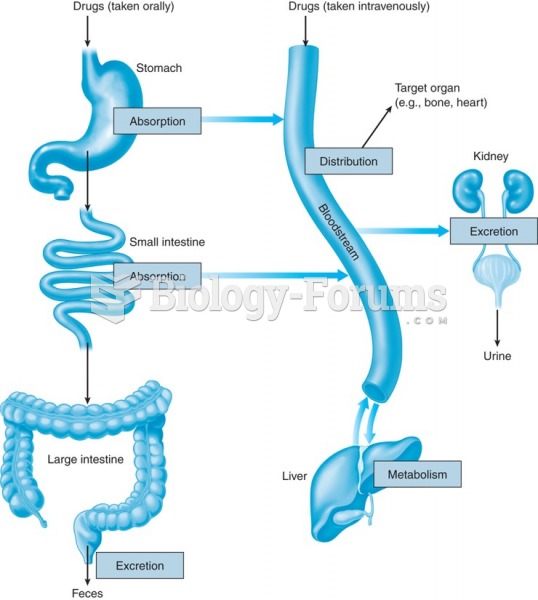 Movement of a drug through the body (pharmacokinetics): absorption, distribution, metabolism, and ...
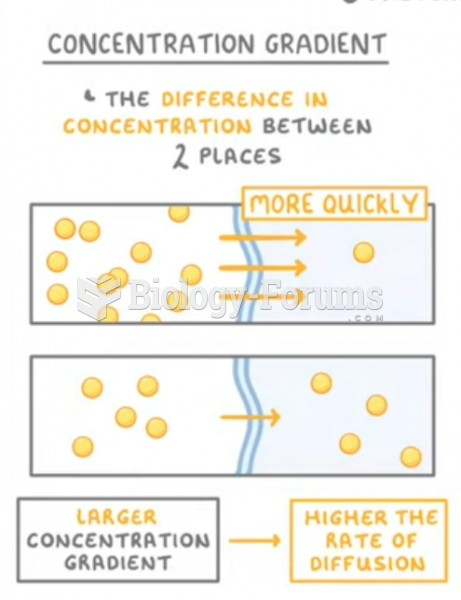
 Molecular Movement
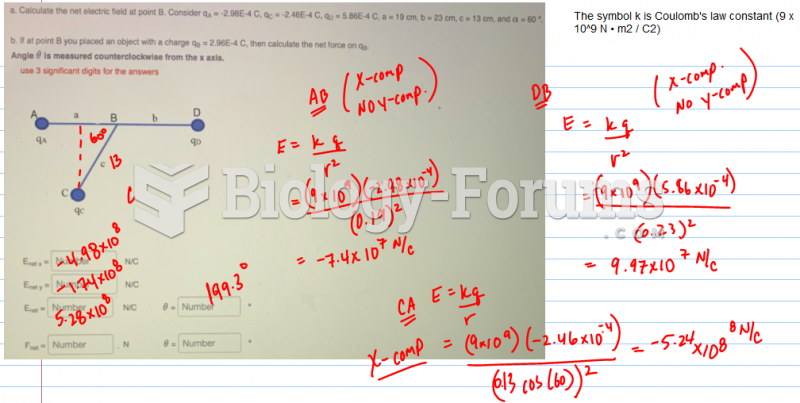 . Calculate the net electric field at point B
 How does slime mold use pulsating movement to search for foods?