This topic contains a solution. Click here to go to the answer
|
|
|

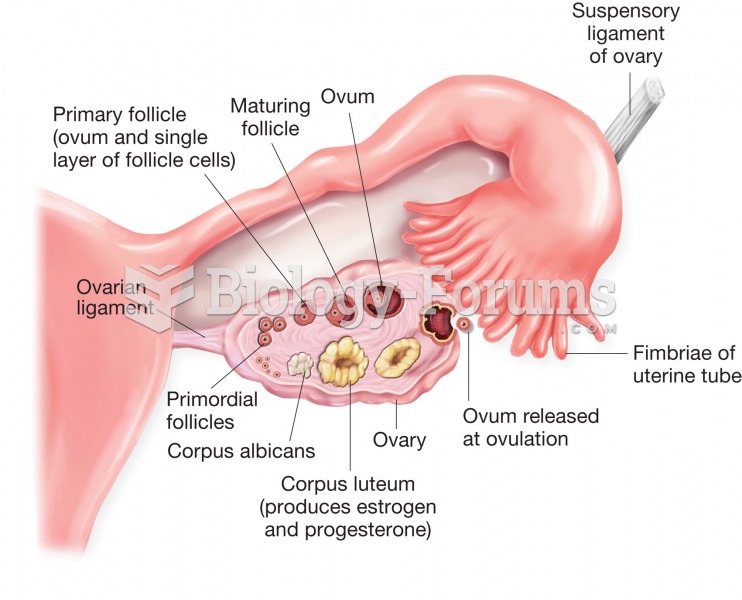 Structure of the ovary and uterine (fallopian) tube. Figure illustrates stages of ovum development a
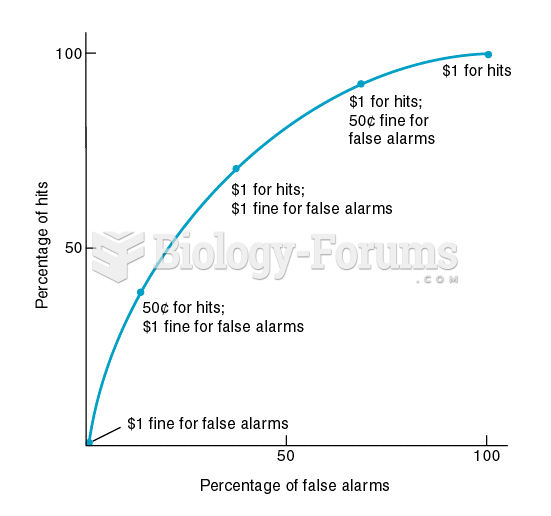 A Receiver-Operating-Characteristic (ROC) Curve
 Human Figure
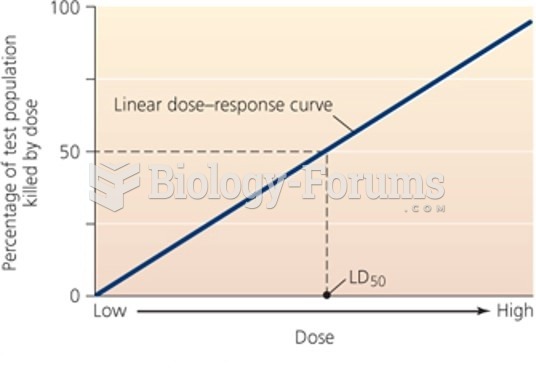 Linear dose-response curve
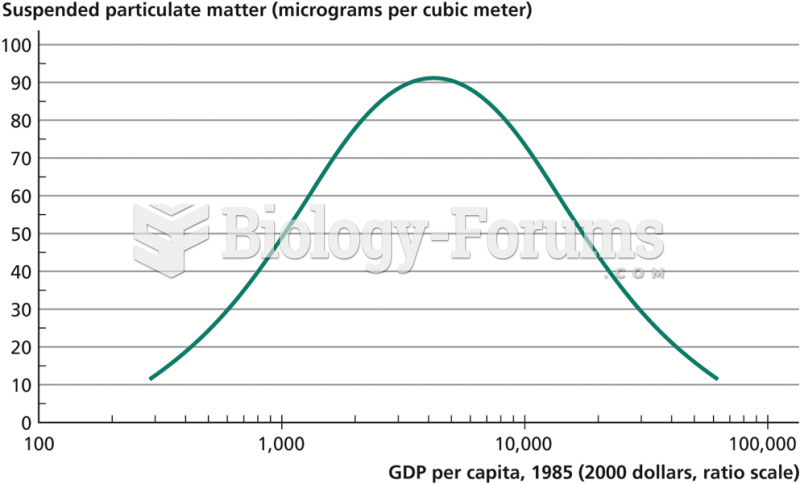 An Environmental Kuznets Curve
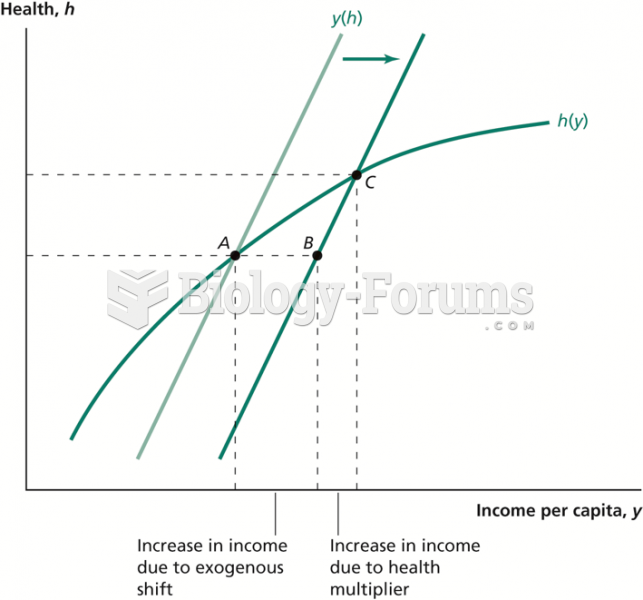 Effect of an Exogenous Shift in Income