This topic contains a solution. Click here to go to the answer
|
|
|

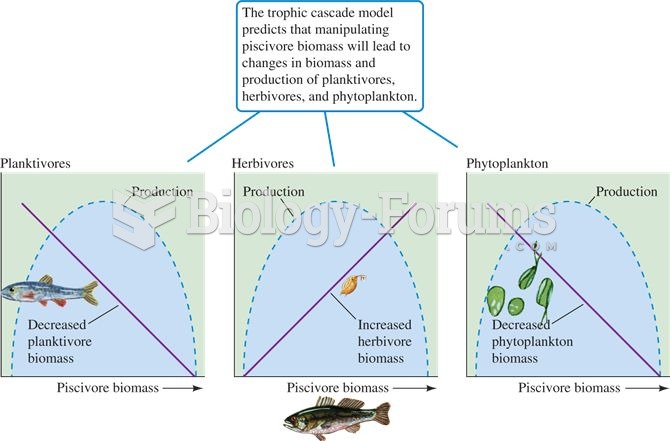 Predicted effects of piscivores on planktivore, herbivore, and phytoplankton biomass and production
 Effects of Groundwater Pumping
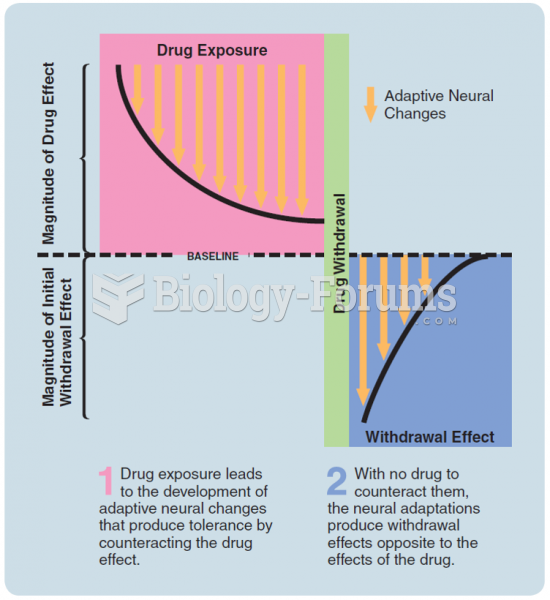 The relation between drug tolerance and withdrawal effects. The same adaptive neurophysiological ...
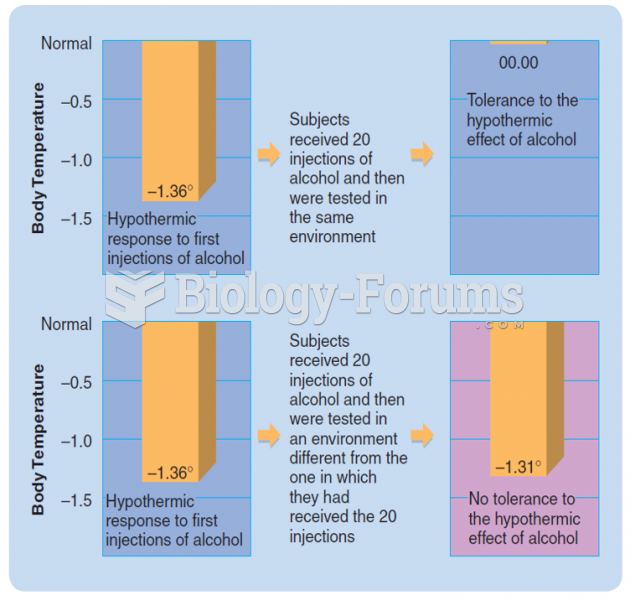 The situational specificity of tolerance to the hypothermic effects of alcohol in rats. (Based on ...
 Dental Related Adverse Effects in Patients Undergoing Cancer Treatment
 Plan of Trajan's Forum and Market "خطة منتدى ترجان والسوق"