You have data for the amount of rainfall in 50 cities for the month of June. The type of graph to best display these data would be a
A) multi-variable time series graph.
B) trend-line diagram.
C) time-series graph.
D) scatter diagram.
E) cross-section graph.
Question 2
An increased federal budget deficit resulting from a recession can actually help stabilize an economy, because corporate profits tend to fall in a recession which, in turn, results in ________ corporate taxes and ________.
A) lower; increases in the price level B) lower; fewer spending cuts for businesses
C) higher; larger profits for businesses D) higher; more tax revenue for the government

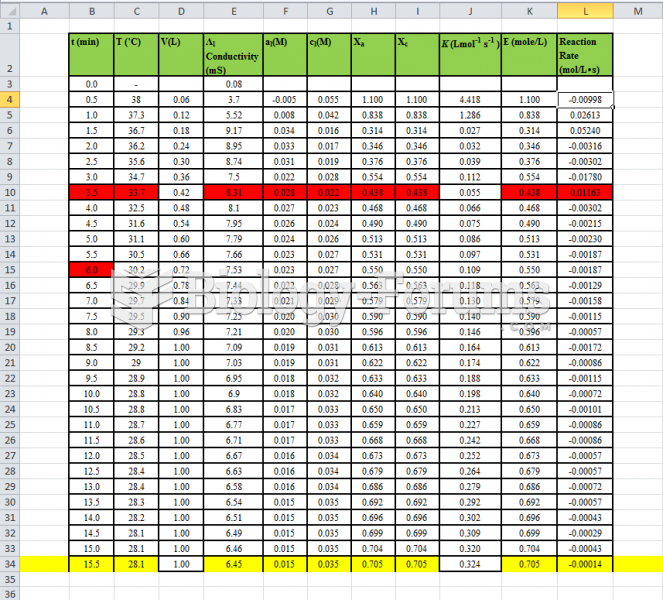 Fluidization - Data Table of experiment
 Calculation of the Amount of the Local Anesthetic and Vasoconstrictor
 Caribbean Cities
 Demographic Data for Nigeria
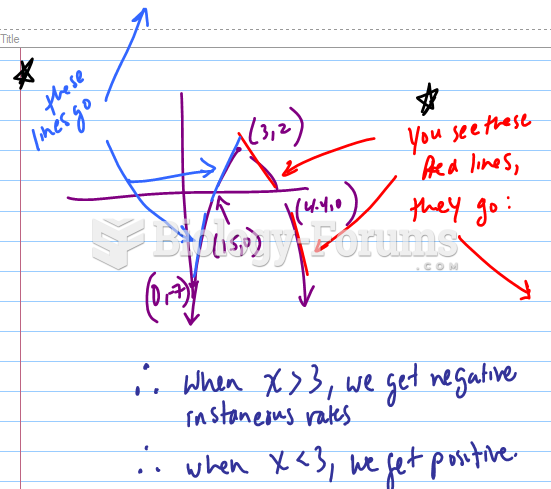 If a graph has the following x-intercepts, which value of x is the instantaneous rate of change ...
 What type of online info about a job candidate should employment mgmt consider when screening