This topic contains a solution. Click here to go to the answer
|
|
|

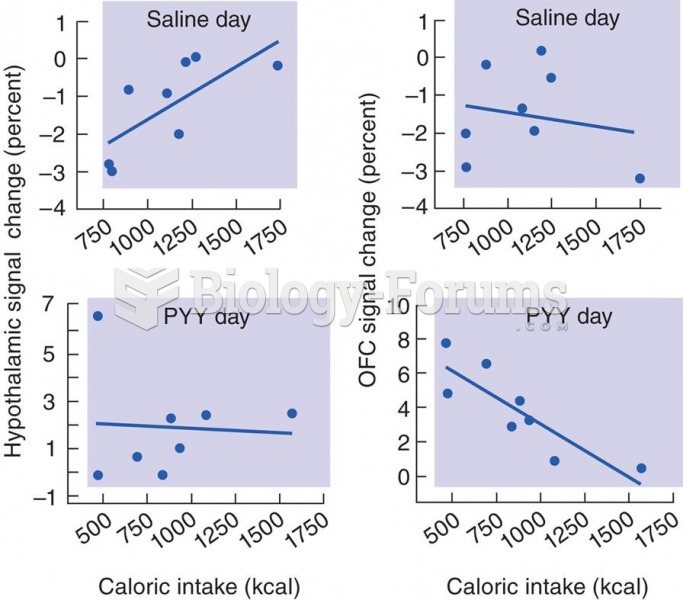 Effects of PYY on Activity of the Hypothalamus and OFC
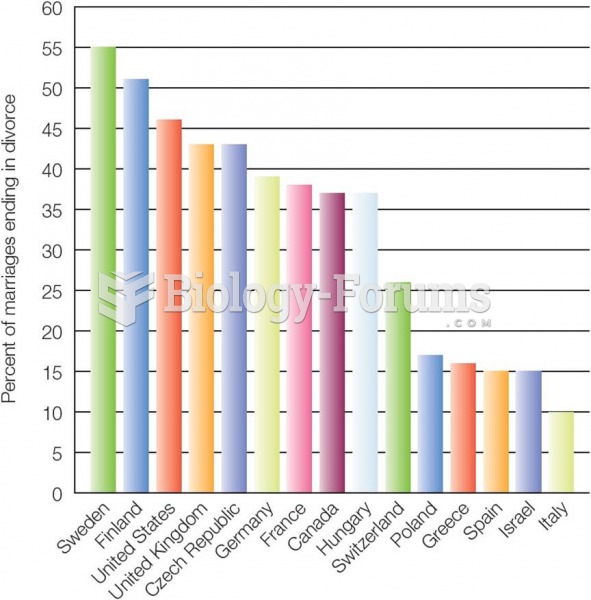 Divorce Rates, Selected Countries In many countries divorce rates have risen in recent decades.
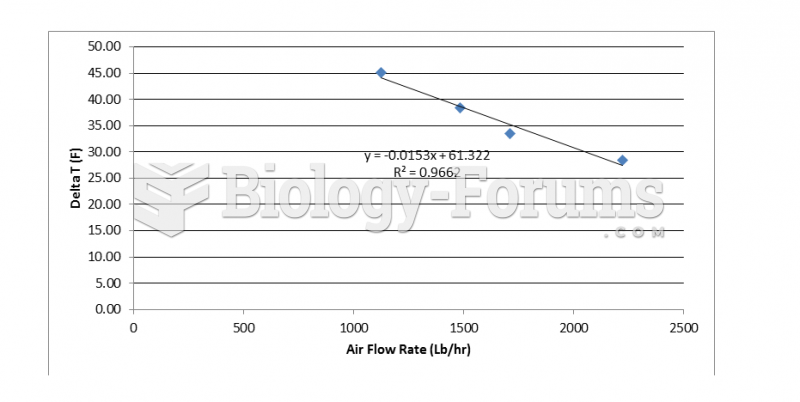 Change in air temperature at various air flow rates for a 2 pass operation
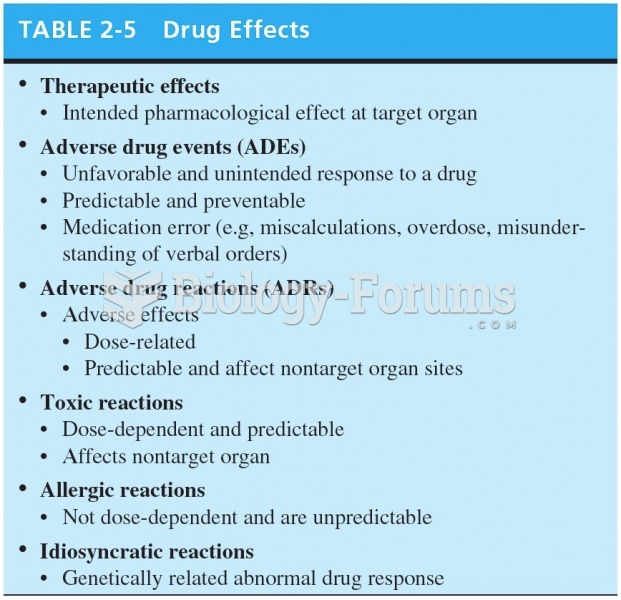 Drug Effects
 Food policy can drive the food industry
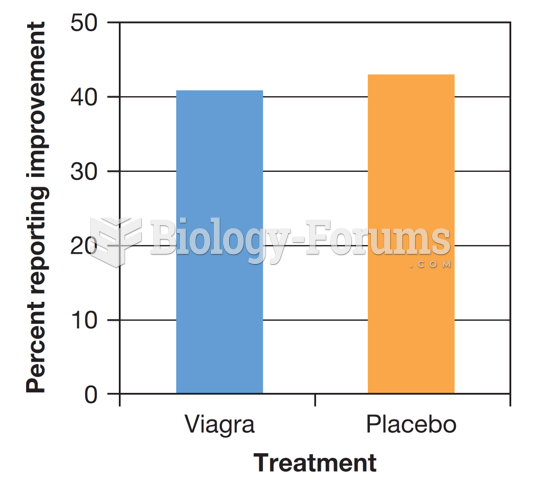 Placebo Effects and Viagra