|
|
|

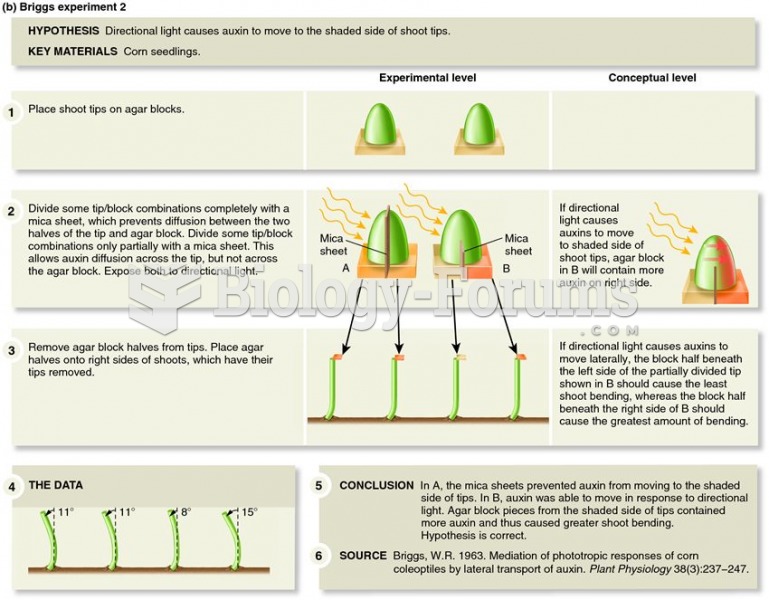 Went and Briggs demonstrated the relationship between light perception and auxin function.
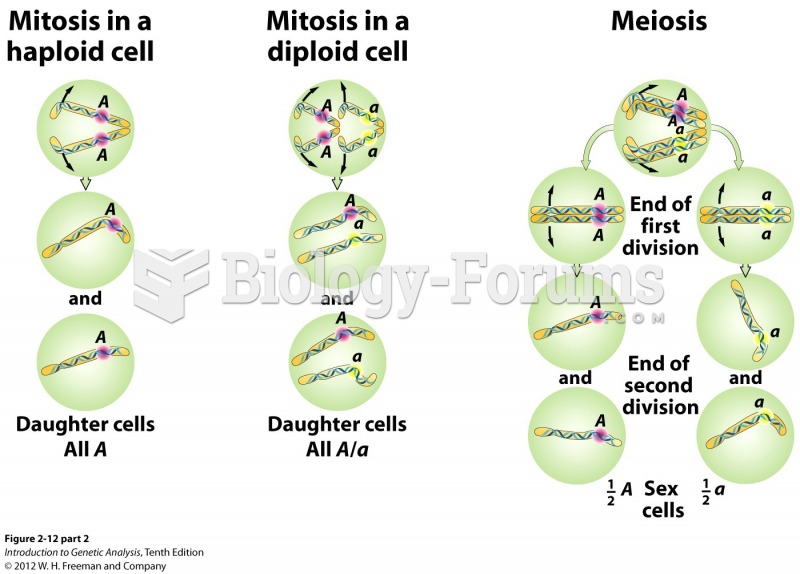 Nuclear division at the DNA level
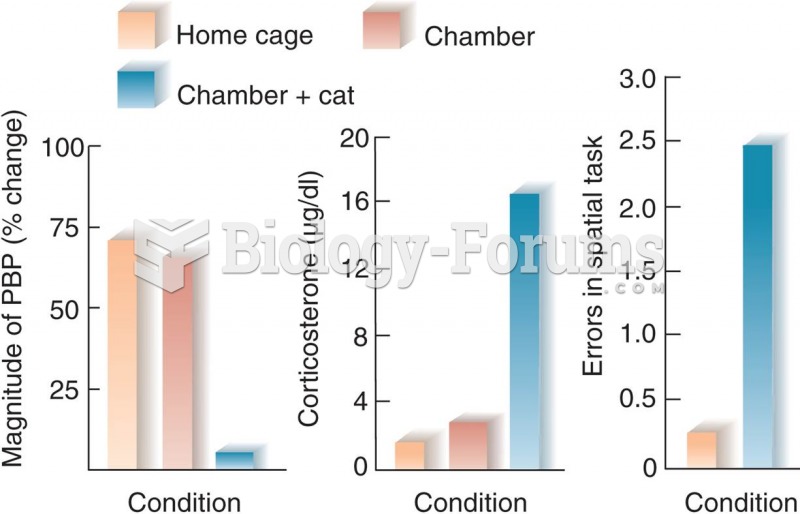 Acute Stress, Glucocorticoid Level, Synaptic Plasticity, and Learning
 Shy children often have a high arousal level in novel social situations. Over time, parents can help ...
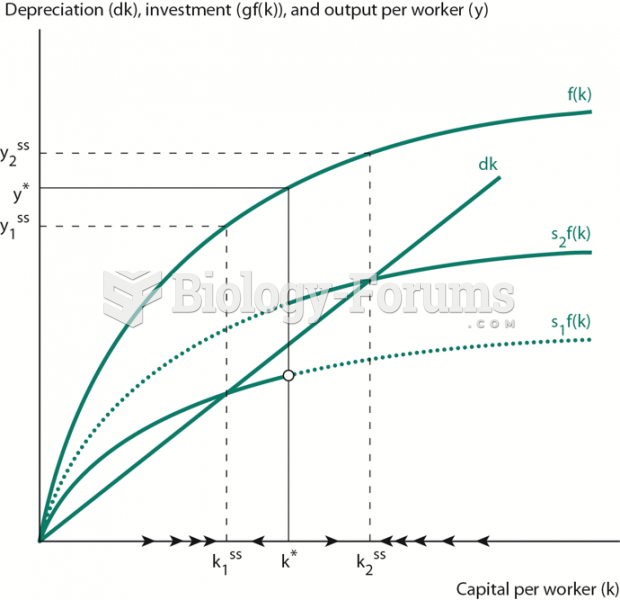 Solow Model with Saving Dependent on Income Level
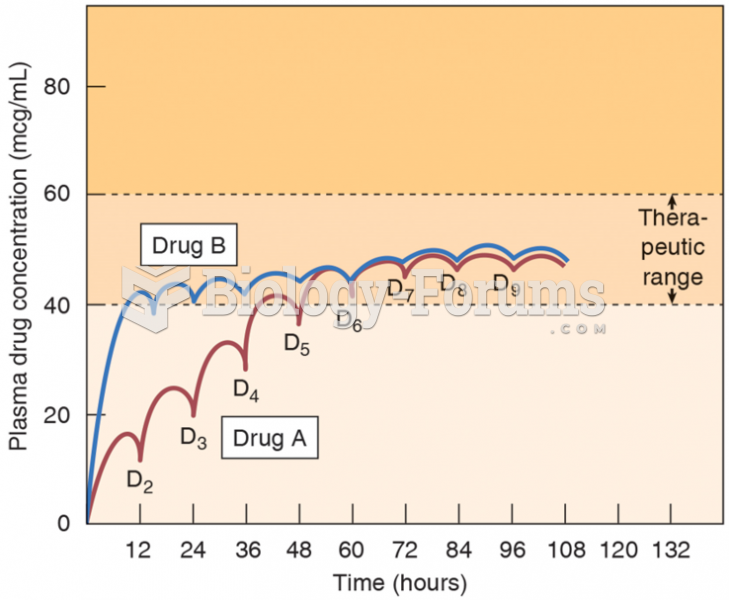 A Drug’s Plateau Level