|
|
|

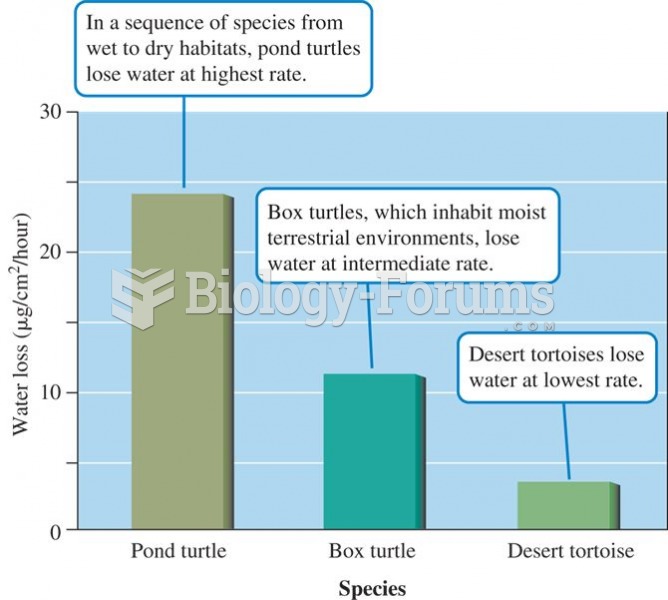 Rates of water loss by two turtles and a tortoise indicate an inverse relationship between the dryne
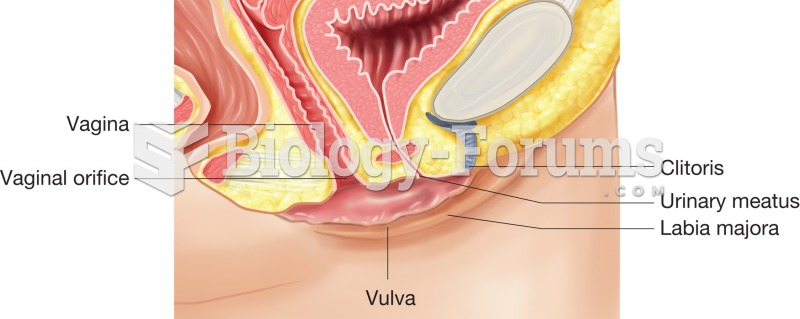 The vulva, sagittal section illustrating how the labia majora and labia minora cover and protect the
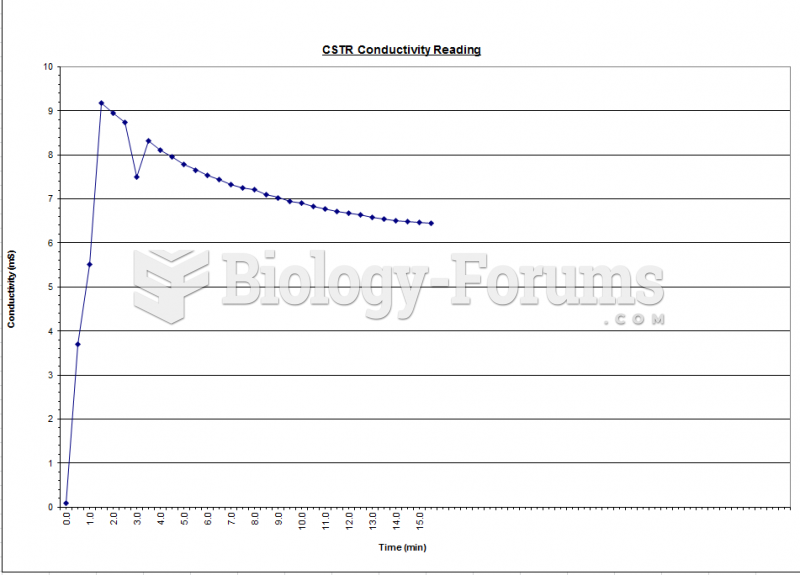 Fluidization - Conductivity Graph
 The Economics of Money, Banking and Financial Markets, Business School Edition
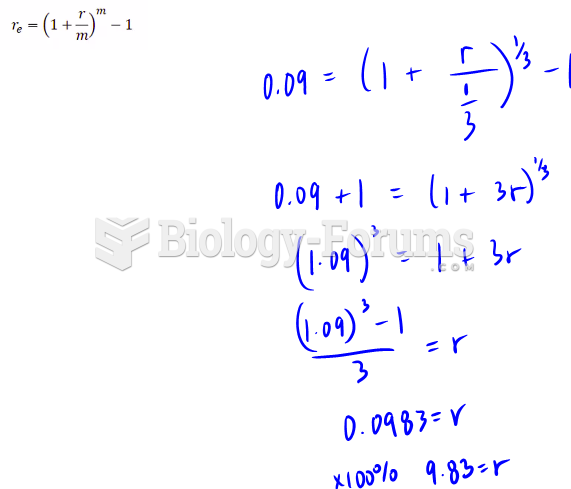 What rate, compounded once every 3 years, is equivalent to 9% effective rate?
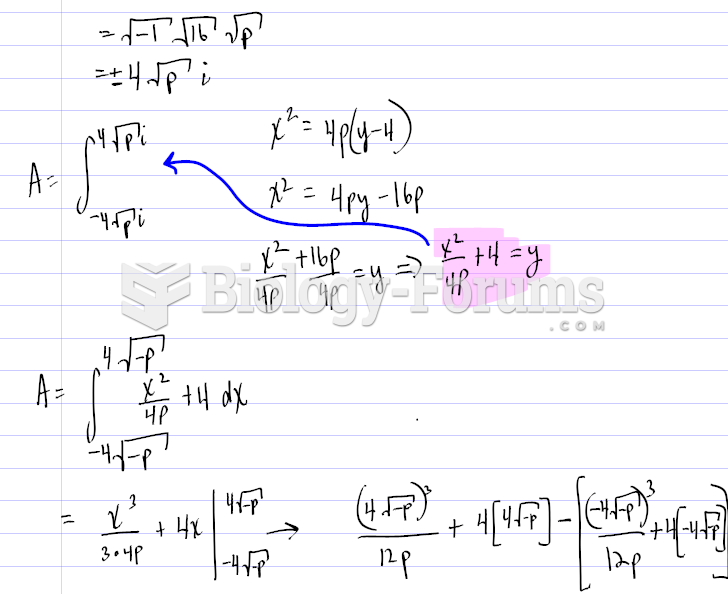 Finding the graph of a Parabola using certain values