This topic contains a solution. Click here to go to the answer
|
|
|

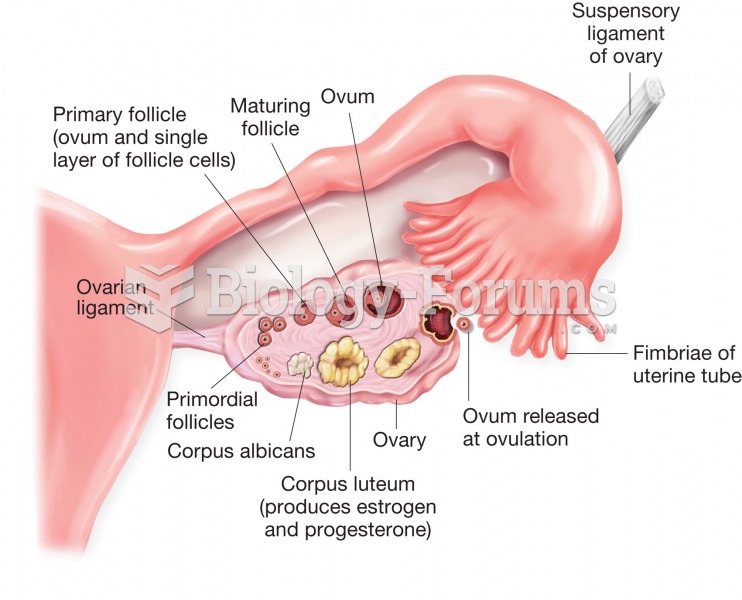 Structure of the ovary and uterine (fallopian) tube. Figure illustrates stages of ovum development a
 How to create a table of values from an equation and graph
 Relationship between Income Inequality and the Desired Tax Rate
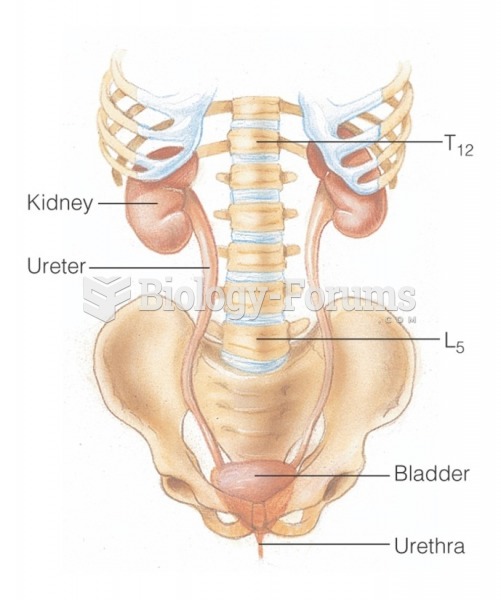 The urinary system: Relationship of the kidneys to the vertebrae
 Infant and Toddler Development and Responsive Program Planning: A Relationship-Based Approach
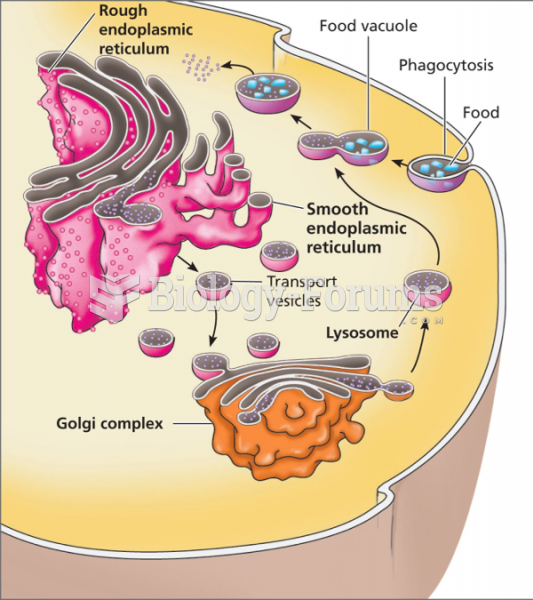 The relationship between the Golgi complex and lysosomes