This topic contains a solution. Click here to go to the answer
|
|
|

 For millions of people, the United States represents a land of opportunity and freedom from ...
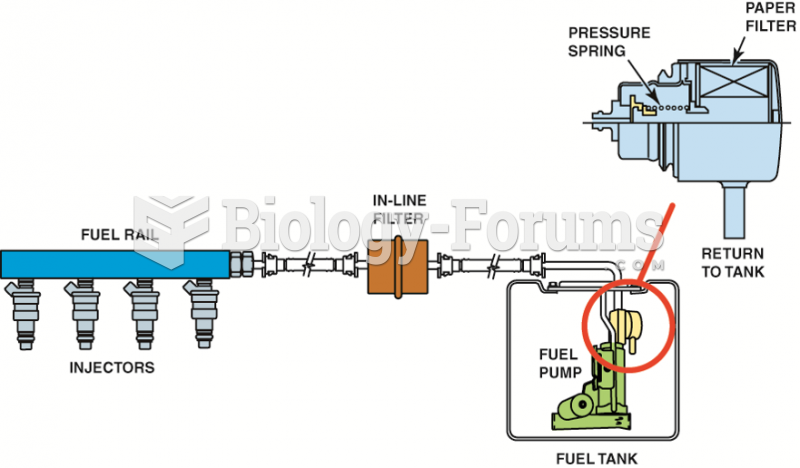 A demand delivery system uses a fuel-pressure regulator attached to the fuel pump assembly inside ...
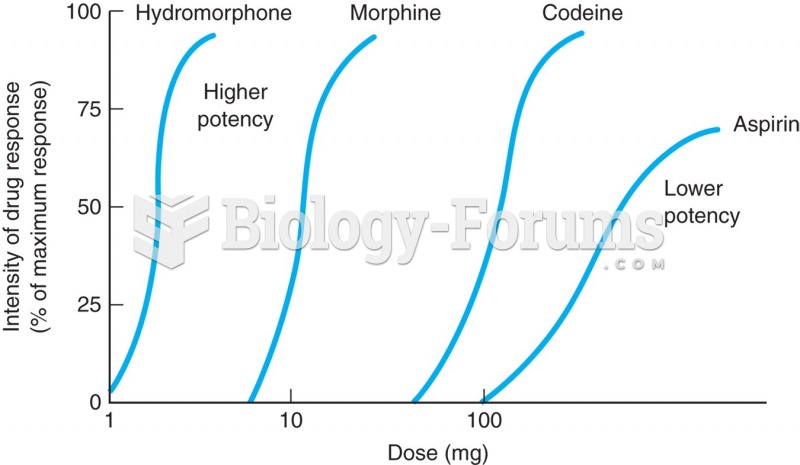 Effect-log dose curve for the analgesic action of three narcotics and aspirin. Hydromorphone is more ...
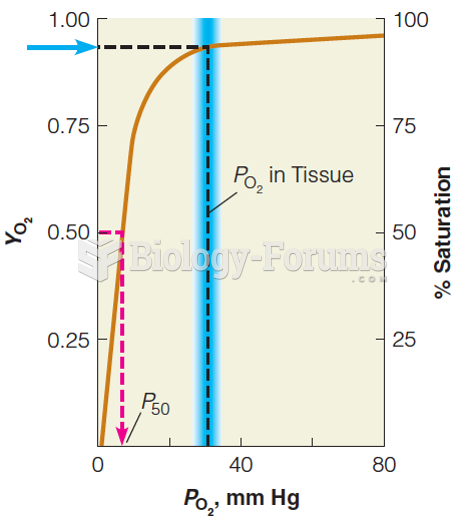 Oxygen-binding curve for myoglobin
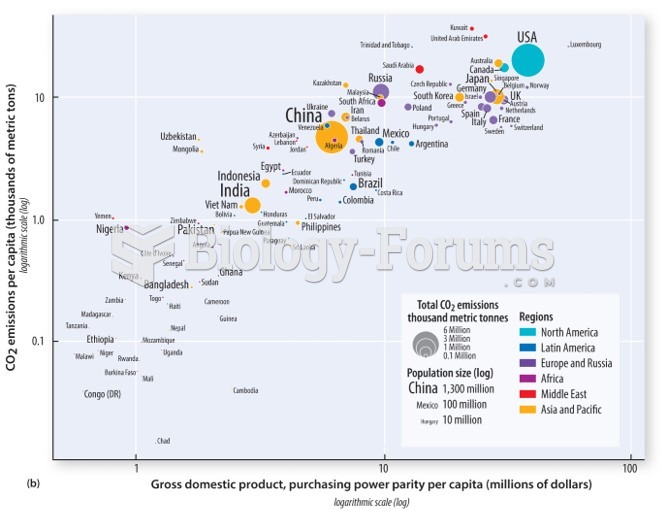 A close relationship between greenhouse gas emissions and a country’s gross domestic product
 To find the derivative use product rule