|
|
|

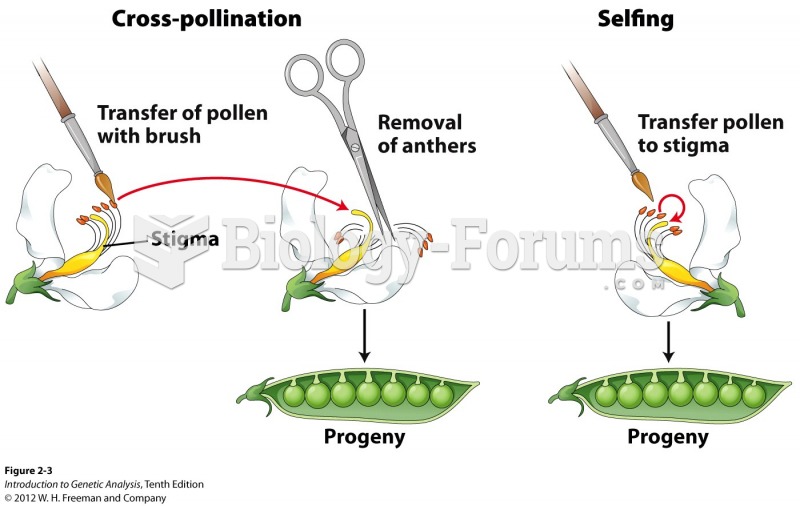 Cross-pollination and selfing are two types of crosses
 A pharmacist can explain to a patient why medication may look different and ensure the correct ...
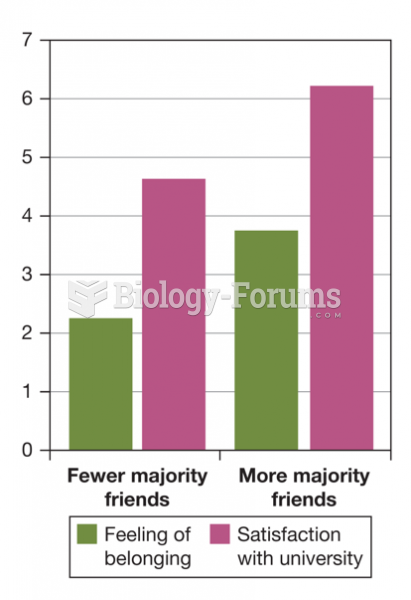 The Impact of Cross-Ethnic Friendships on Minority Students’ Well-Being
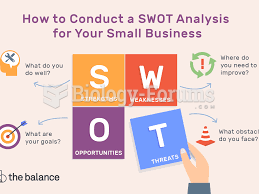 Swot analysis
 Table - Correlation Analysis
 An electropherogram showing the results of a DNA profile analysis