Answer to Question 1
1. Here is the regression data for monthly operating costs as a function of the total freight miles travelled by Sprit vehicles:
SUMMARY OUTPUT
Regression Statistics
Multiple R 0.927299101
R Square 0.859883623
Adjusted R Square 0.845871986
Standard Error 132.0816002
Observations 12
ANOVA
df SS MS F Significance F
Regression 1 1070620.18 1070620.18 61.37 0.00
Residual 10 174455.49 17445.55
Total 11 1245075.67
Coefficients Standard Error t Stat P-value Lower 95 Upper 95
Intercept 445.76 112.97 3.95 0.00 194.04 697.48
X Variable 1 0.26 0.03 7.83 0.00 0.18 0.33
2. The chart below presents the data and the estimated regression line for the relationship between monthly operating costs and freight miles traveled by Spirit Freightways.
Economic
plausibility A positive relationship between freight miles traveled and monthly operating costs is economically plausible since increased levels of economic activity should lead to the consumption of greater amounts of labor, fuel and other operating expenses.
Goodness of fit r2 = 86, Adjusted r2 = 85
Standard error of regression = 132.08
Excellent fit; there is indisputable evidence of a linear relationship between the dependent and independent variables. The distances between the estimated line and the actual data points are small, other than at the highest level of activity recorded during the year.
Significance of Independent
Variables The t-value of 7.83 for freight miles traveled output units is significant at the 0.05 and 0.01 levels.
3. If Brown expects Spirit to generate an average of 3,600 miles each month next year, the best estimate of operating costs is given by:
Monthly operating costs = 445.76 + (0.26) (3,600 miles) = 1,381.76.
Annual operating costs = (1,381.76) 12 = 16,581.12.
4. Three variables, other than freight miles, that Brown might expect to be important cost drivers for Spirit's operating costs are: input prices (fuel prices and wage rates), mix of agricultural output carried (weight, volume, value), and route mix and conditions (weather, flat versus mountainous terrain, short-haul versus long-haul carriage).
5. Here is the regression data for monthly maintenance costs as a function of the total freight miles travelled by Sprit vehicles:
SUMMARY OUTPUT
Regression Statistics
Multiple R 0.87887319
R Square 0.77241808
Adjusted R Square 0.74965989
Standard Error 106.470794
Observations 12
ANOVA
df SS MS F Significance F
Regression 1 384747.37 384747.37 33.94 0.00
Residual 10 113360.30 11336.03
Total 11 498107.67
Coefficients Standard Error t Stat P-value Lower 95 Upper 95
Intercept 1170.57 91.07 12.85 0.00 967.66 1373.48
X Variable 1 0.15 0.03 5.83 0.00 0.21 0.09
The data and regression estimate are provided in the chart below:
6. At first glance, the regression result in requirement 5 is surprising and economically implausible. In the regression, the coefficient on freight miles traveled has a negative sign. This implies that the greater the number of freight miles (i.e., the more activity Spirit carries out), the smaller are the maintenance costs; specifically, it suggests that each extra freight mile reduces maintenance costs by 0.14 (recall that all data are in thousands). Clearly, this estimated relationship is not economically credible. However, one would think that freight miles should have some impact on fleet maintenance costs.
The logic behind the estimated regression becomes clearer once one realizes that maintenance costs have a discretionary component to them, especially in terms of timing. Spirit's peak months of work transporting agricultural products in western Canada occur in late spring and summer (the period from April through August). It is likely that Spirit is simply choosing to defer maintenance to those months when its vehicles are not in use, thereby creating a negative relationship between monthly activity and maintenance costs. The causality also goes the other wayif vehicles are in the shop for maintenance, they are clearly not on the road generating freight miles. A third reason is that vehicles might need to be serviced at greater frequency during the winter months because of the wear and tear that comes from driving on icy terrain and in poor weather conditions.
Possible alternative specifications that would better capture the link between Spirit's activity levels and the spending on maintenance are to estimate the relationship using annual data over a period of several years, to look at spending on corrective rather than preventive maintenance, or to look at the relation using lags (i.e., freight miles traveled in a period against the spending on maintenance done in a subsequent period in order to service the vehicles).
Answer to Question 2
C

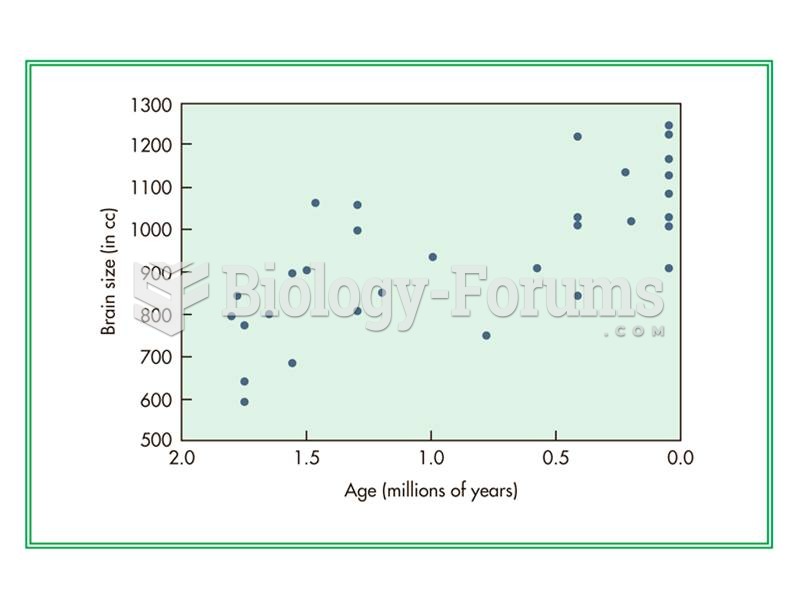 Although average brain size increases gradually though time in H. erectus, individuals with small br
 Barenaked Ladies - Lovers in a Dangerous Time
 Time course of HIV infection.
 Position of the fetus in late pregnancy results in stresses on the mother’s body.
 Results of a genome-wide association study (GWAS) to detect SNPs
 The Geologic Time Scale