This topic contains a solution. Click here to go to the answer
|
|
|

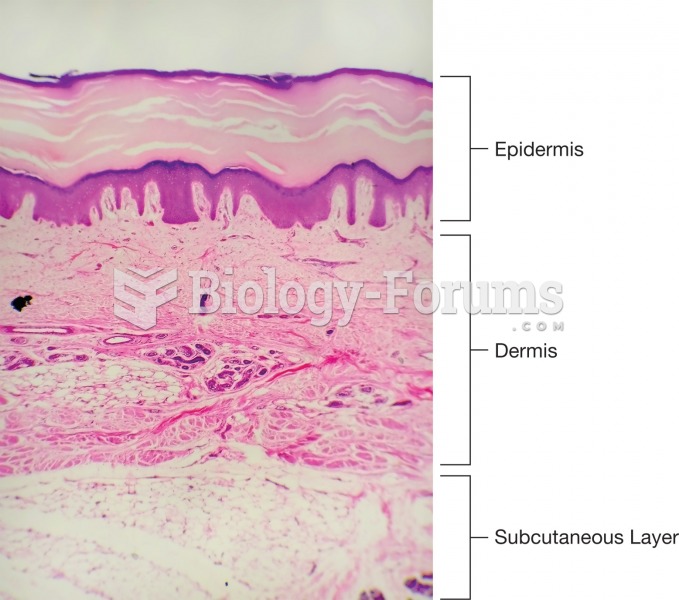 Photomicro graph showing the three layers of the skin.
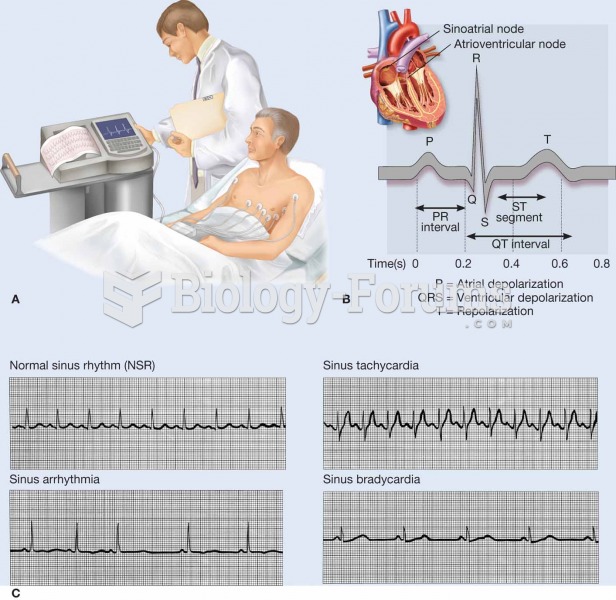 An electrocardiogram (ECG, EKG) is a commonly used procedure in which the electrical events associat
 Log graph paper
 How to create a table of values from an equation and graph
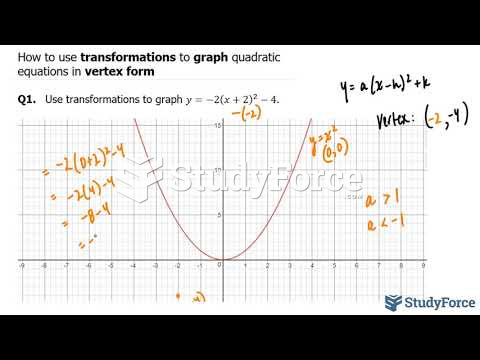 How to use transformations to graph quadratic equations in vertex form
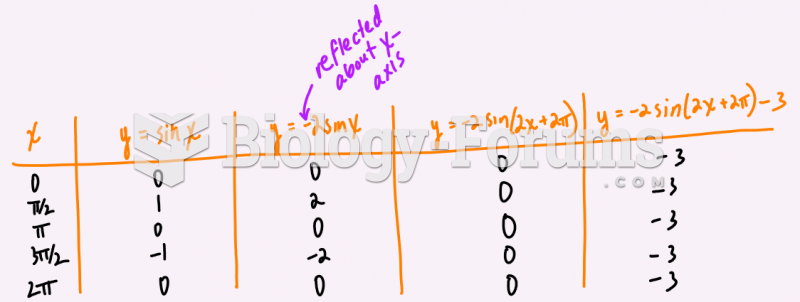 State the transformations on the function f(x)= 4sin(x-pi)-2 and then graph two cycles below.