Answer to Question 1
ANS: A, B, C, D, F, G, H
To perform statistical analysis of data from a quantitative study, one must be able to (1) determine the necessary sample size to adequately power your study, (2) prepare the data for analysis, (3) describe the sample, (4) test the reliability of measures used in the study, (5) perform exploratory analyses of the data, (6) perform analyses guided by the study objectives, questions, or hypotheses, and (7) interpret the results of statistical procedures. If the researcher is not able to do all of these, a statistician is consulted. Descriptions of the sample demographics are made statistically.
Answer to Question 2
ANS: A, B, D, E
The range, standard deviation, and variance are statistics that describe the extent to which the values in the sample vary from one another. The most common of these statistics to be reported in the literature is the standard deviation, because of its direct association with the normal curve. If the frequency distribution of any given variable is approximately normal, knowing the standard deviation of that variable allows the reader to know what percentages of subjects' values on that variable fall between +1 and 1 standard deviation. In a normal distribution, when a standard deviation is calculated, 34.13 of the values are between the mean score and 1 standard deviation above the mean. Similarly, 34.13 of the values are between the mean score and 1 standard deviation below the mean. The middle 95.44 of the subjects' scores are between +2 standard deviations and 2 standard deviations.

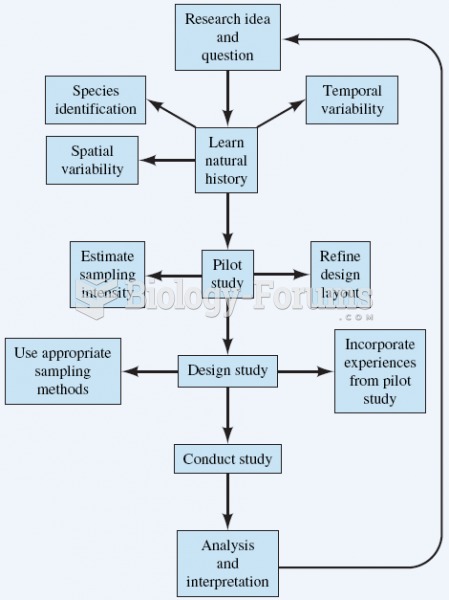 Much time and effort occurs between the development of a research idea and the statistical analysis
 A killer whale plays with a ball of ice, soon after a researcher had thrown a snowball at the whale.
 Visual Acuity Testing: Assist the patient in occluding the eye.
 Many European Americans are involved in ethnic work, attempting to maintain an identity more precise ...
 How does PCA reduce the dimension of a statistical problem? How do you select the reduced ...
 How does PCA reduce the dimension of a statistical problem? How do you select the reduced ...