|
|
|

 Iliopsoas Muscle Test
 Evaluation of a child for cystic fibrosis with a sweat chloride test. Sweat is being collected under
 The Mantoux tuberculin skin test. Positive reaction.
 A company that makes environmental measuring devices has calculated their revenue and costs as ...
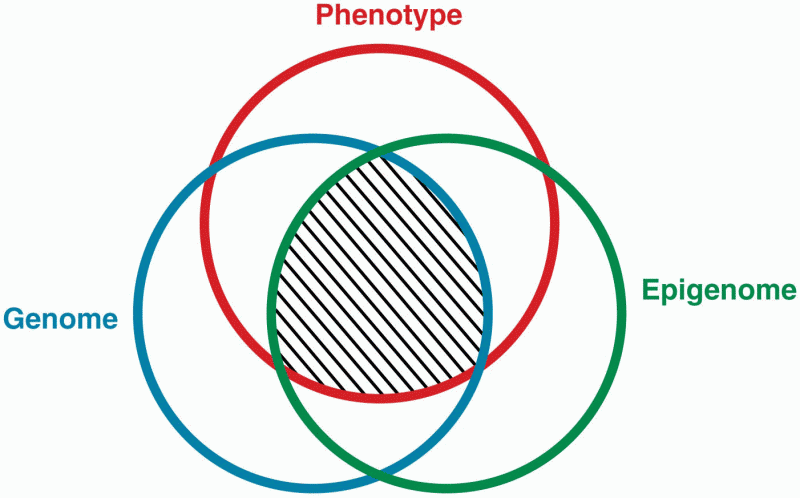 The phenotype of an organism is the product of interactions
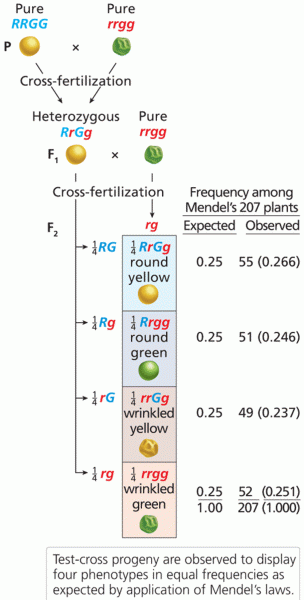 Mendel’s test cross to verify independent assortment