This topic contains a solution. Click here to go to the answer
|
|
|

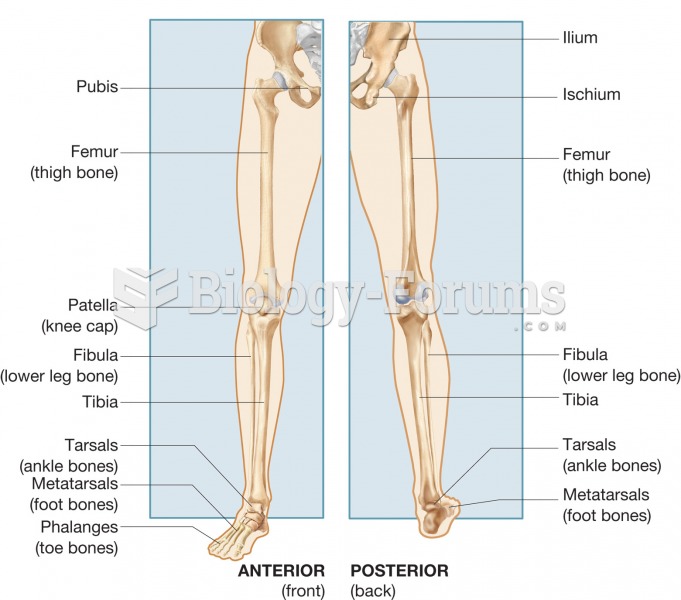 Anatomical and common names for the pelvic girdle and lower extremity.
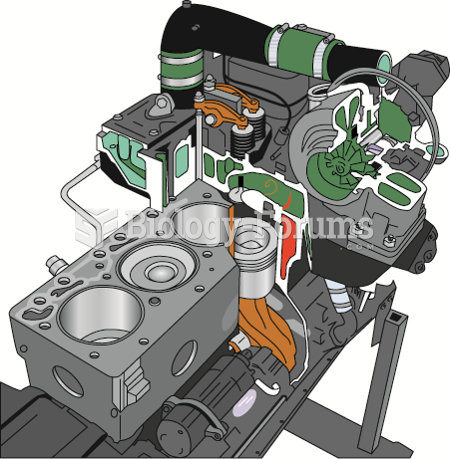 The common rail on a Cummins diesel engine. A high-pressure pump (up to 30,000 PSI) is used to ...
 Stress and the Common Cold
 Satellite data showing net primary production. Productivity is coded as red (highest) down through o
 Chi-Square Analysis of Mendel’s Trihybrid-Cross Data
 Manhattan plots resulting from a genome-wide association study of seven common human disease