This topic contains a solution. Click here to go to the answer
|
|
|

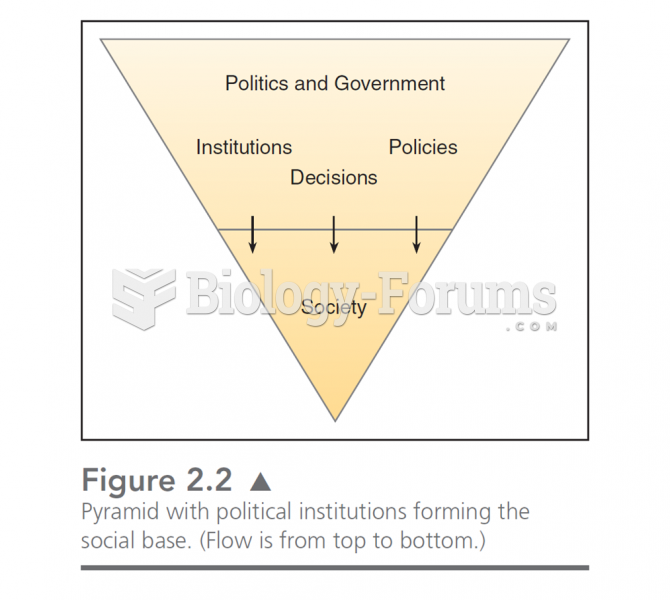 This chart illustrates the “drip down” model of government. In this, politics is formed by the soc
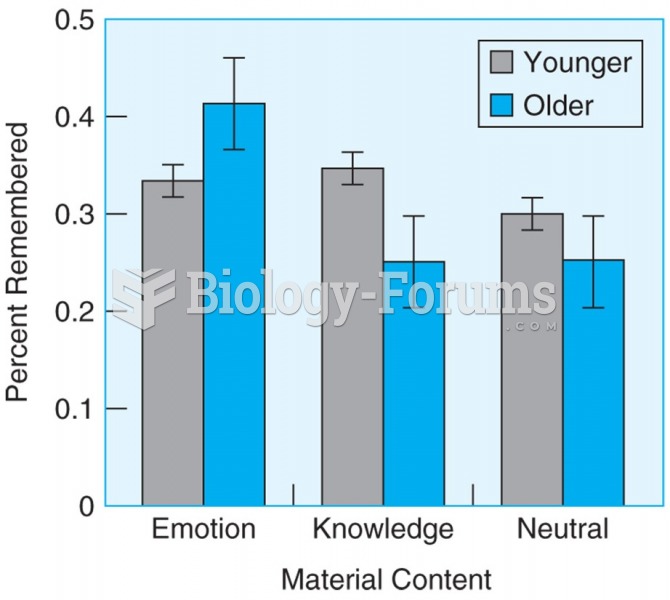 Older participants remember more information than younger participants when material has emotional ...
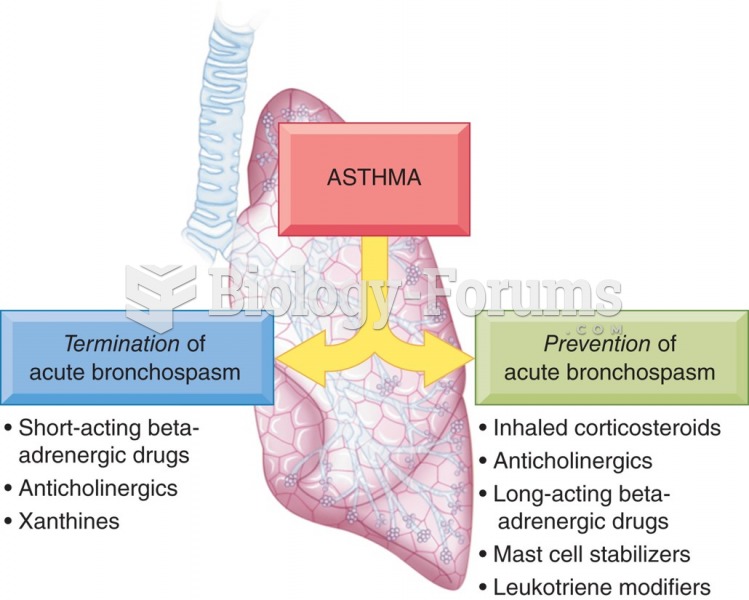 Drug classes used in the pharmacotherapy of asthma.
 Embryonic Period
 No payments were made on a $2,598 loan during its three-year term. What was the annually ...