This topic contains a solution. Click here to go to the answer
|
|
|

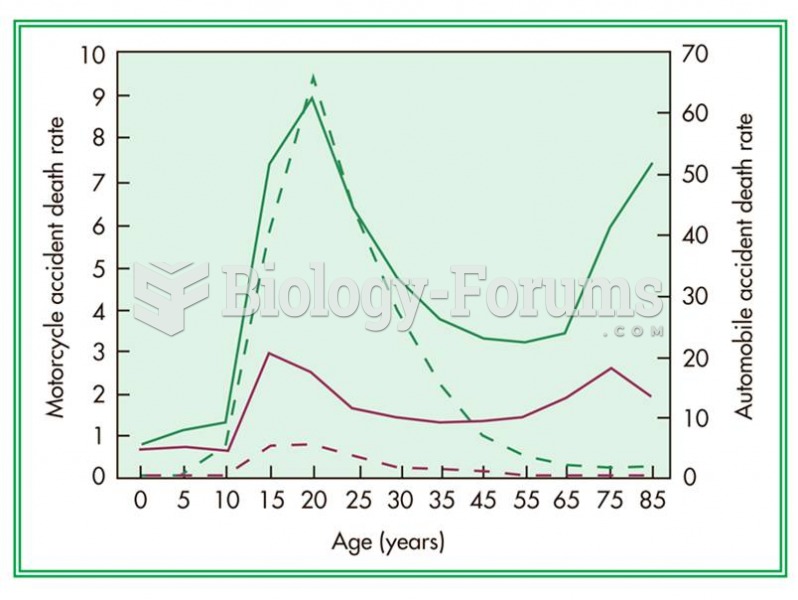 Risk of death from motorcycle accidents (dashed lines) and passenger accidents (solid lines) per 100
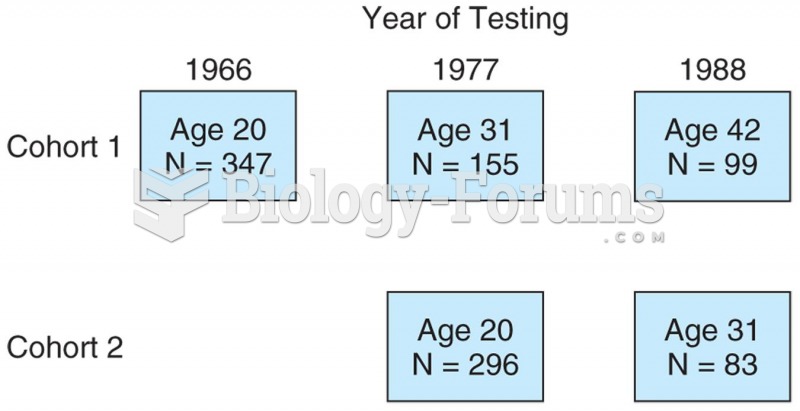 Model of a sequential study in which two cohorts were followed beginning at age 20. One cohort was f
 The Crystal Cathedral was erected in 1980 in Garden Grove, California, by Dr. Robert H. Schuller, a ...
 The age-related increase in spirituality is different for two cohorts born seven years apart. The ...
 Horizontal, sagittal, and coronal functional MRIs show areas of increased activity in the primary ...
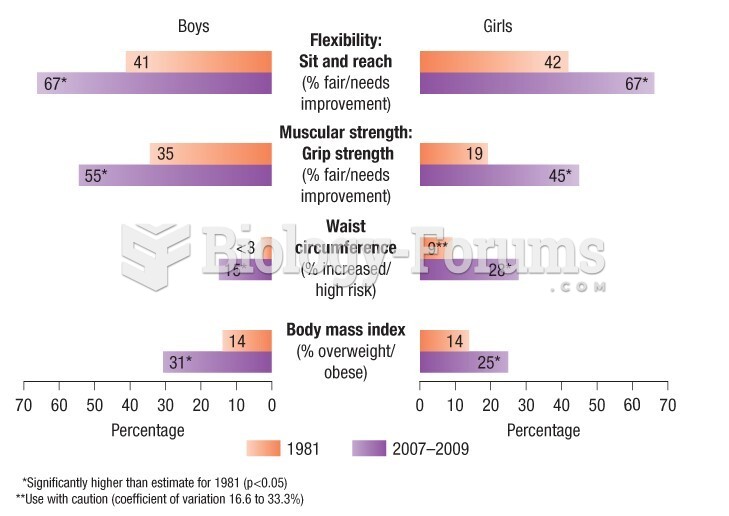 Percentage of youth age 15 to 19 years with at-risk levels of body composition & fitness