This topic contains a solution. Click here to go to the answer
|
|
|

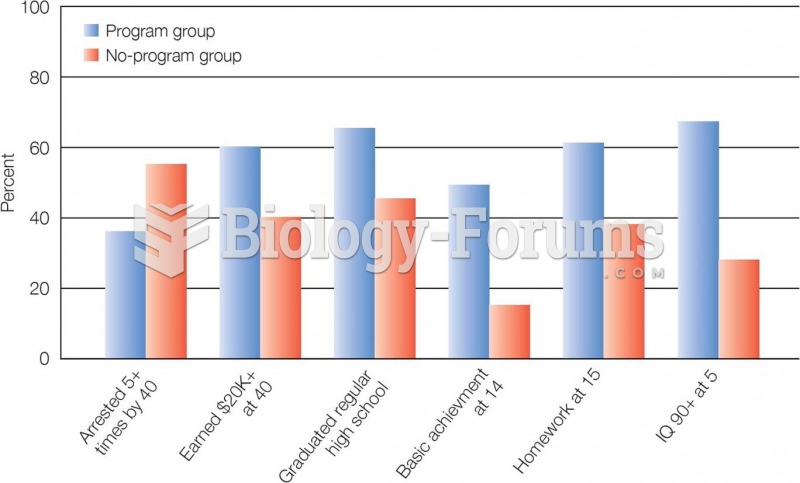 Major Findings of the High Scope Preschool Study High Scope participants showed better academic per
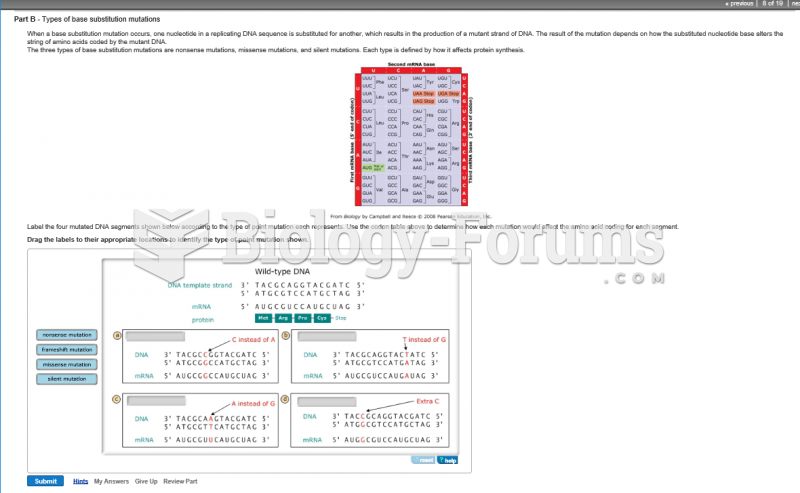 Label the four mutated DNA segments shown below according to the type of point mutation each ...
 Gerotor-type oil pump driven by the crankshaft.
 How to solve a linear system when the variable is in the denominator position (Question 1 of 2)
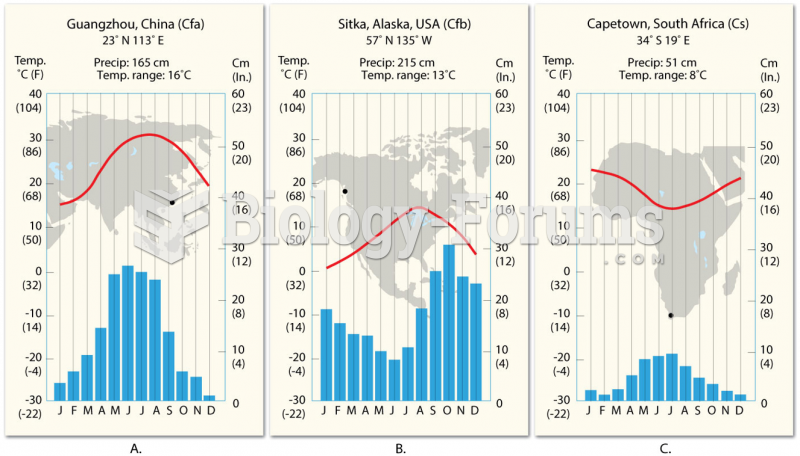 Comparison of C-type Climates
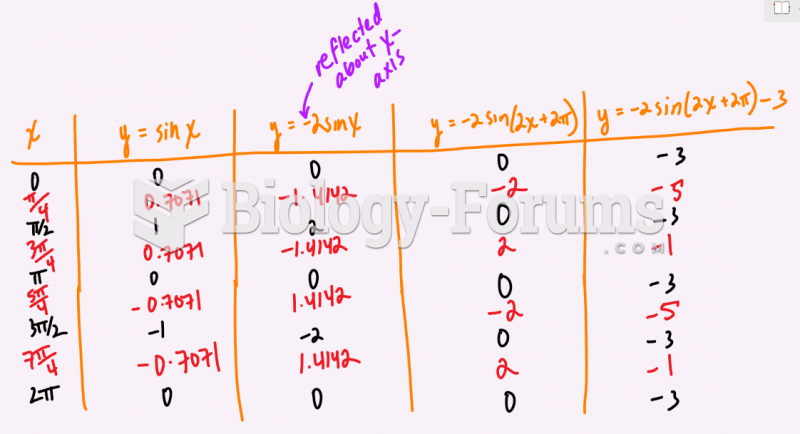 State the transformations on the function f(x)= 4sin(x-pi)-2 and then graph two cycles below.