This topic contains a solution. Click here to go to the answer
|
|
|

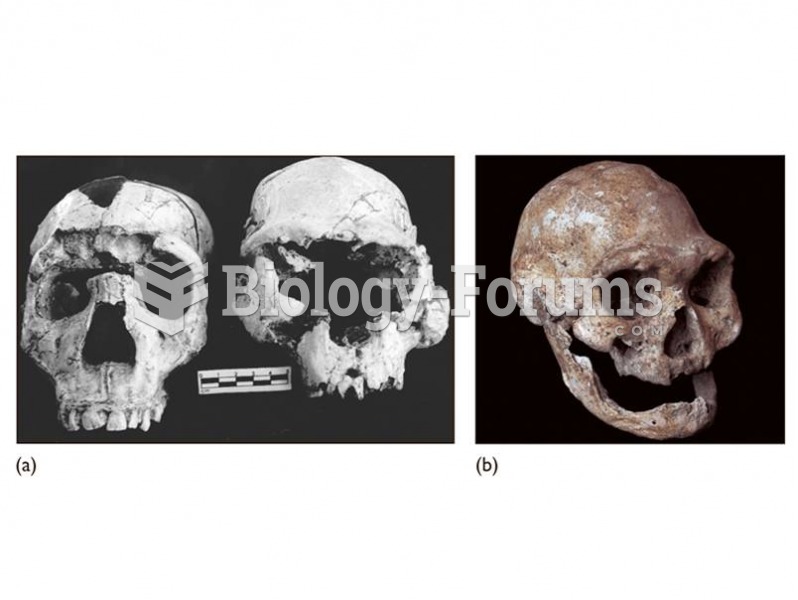 (a) The Dmanisi cranium (right) shows similarities to early African H. erectus including the Narioko
 Effects of Therapy for Stuttering A functional MRI scan shows regions of the superior temporal lobe
 The posted octane rating in most high-altitude areas shows regular at 85 instead of the usual 87.
 The steel lamination used in an E coil helps increase the magnetic field strength, which helps the ...
 Increased neurogenesis in the dentate gyrus following damage. The left panel shows (1) an ...
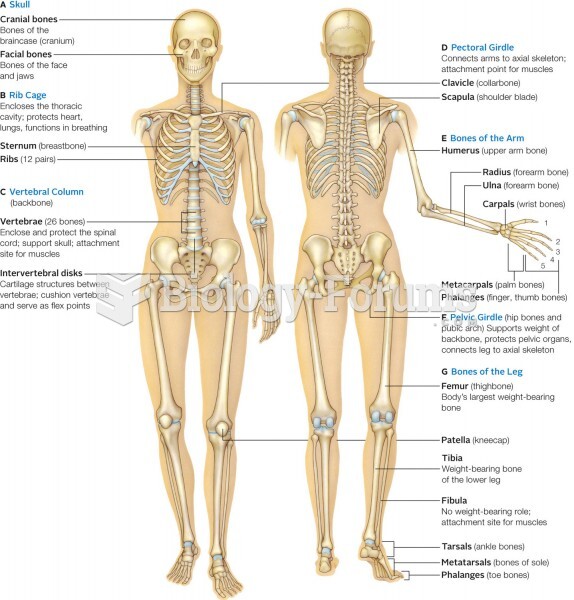 Major bone (tan) and cartilage (light blue) elements of the human skeleton. Inset shows regions of v