This topic contains a solution. Click here to go to the answer
|
|
|

 Differences in the number and location of flagella.
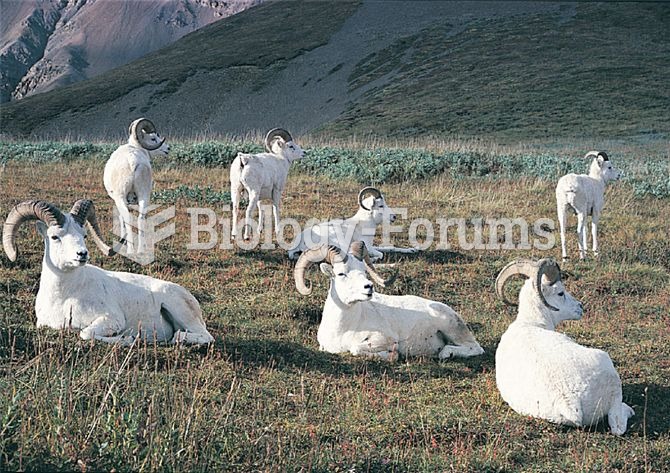 The Dall sheep, Ovis dalli, a mountain sheep of far northern North America, was the subject of one o
 The Number of Children Americans Think Are Ideal
 Teaching in America
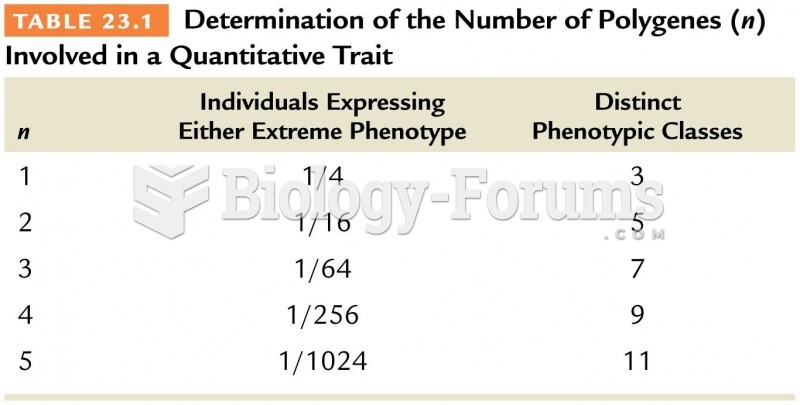 Determination of the Number of Polygenes (n)
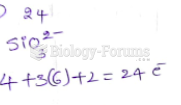 What is the total number of valence electrons in a silicate ion, SiO32-?