This topic contains a solution. Click here to go to the answer
|
|
|

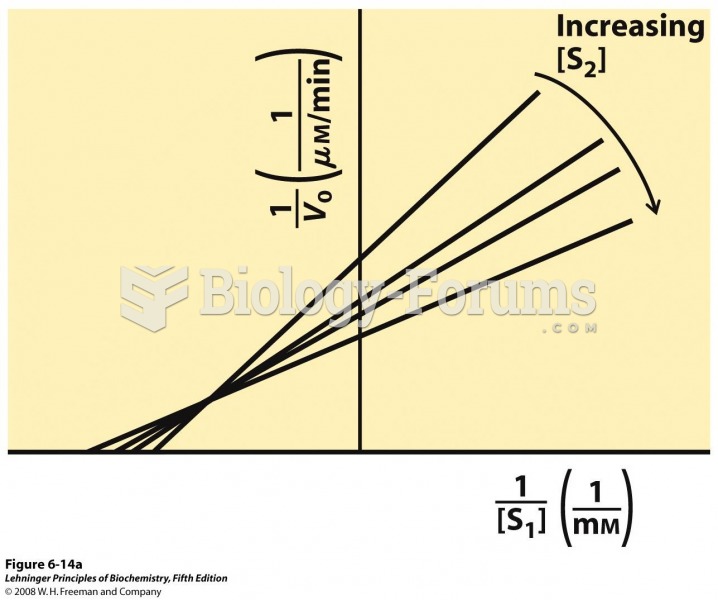 Steady-state kinetic analysis of bisubstrate reactions
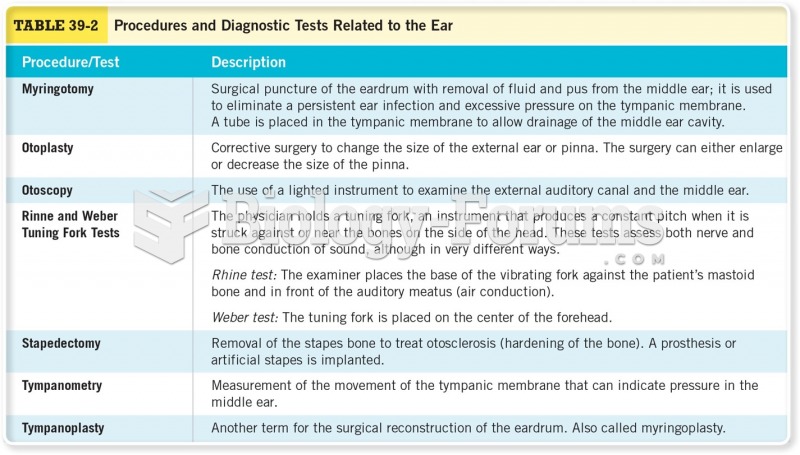 Procedures and Diagnostic Tests Related to the Ear
 How to find the equation of a line that is perpendicular to a line passing through a point
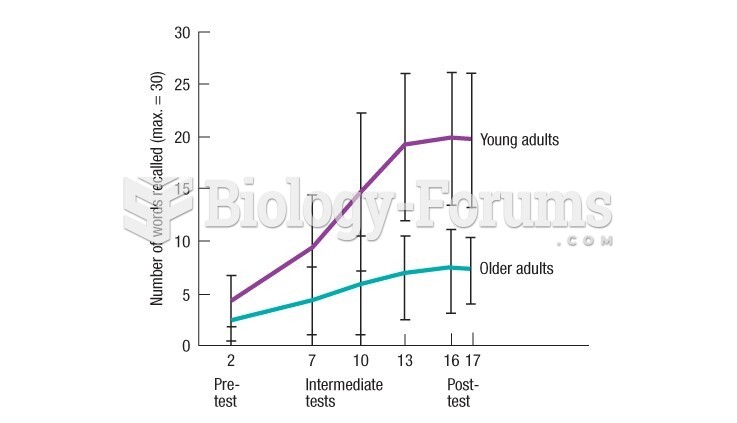 Results from Kliegl's study show that older adults can learn complex information-processing
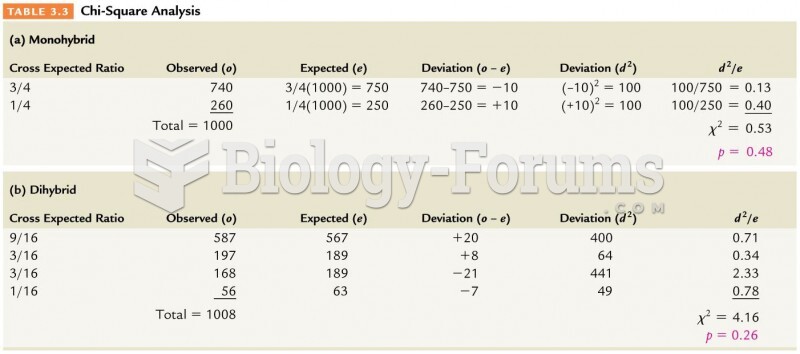 Chi -Squared Analysis
 The forked-line method for determining gamete genotype frequency