This topic contains a solution. Click here to go to the answer
|
|
|

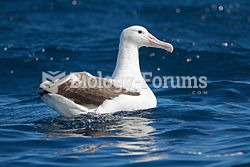 Southern Royal Albatross, Diomedea epomophora, is a large seabird from the albatross family.
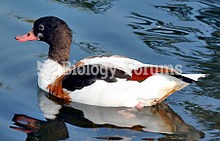 shelducks, genus Tadorna, are a group of large birds in the Tadorninae subfamily of the Anatidae
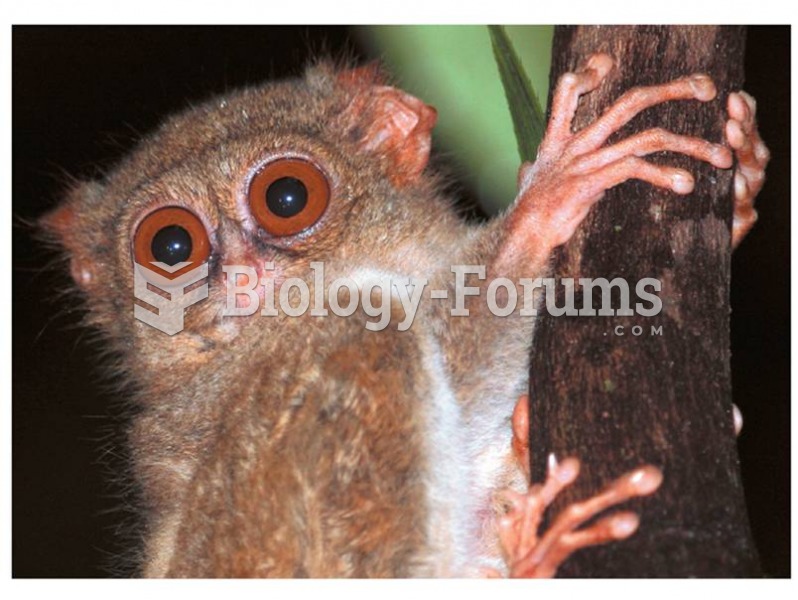 The tarsier is a haplorhine, and may represent an evolutionary bridge between lower and higher prima
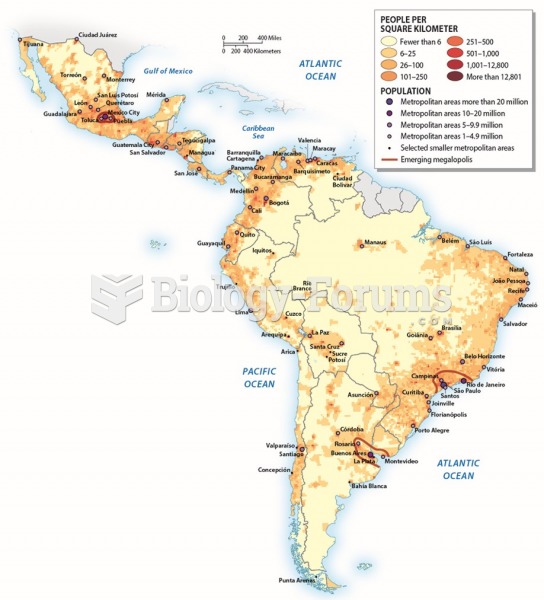 Population and Settlement
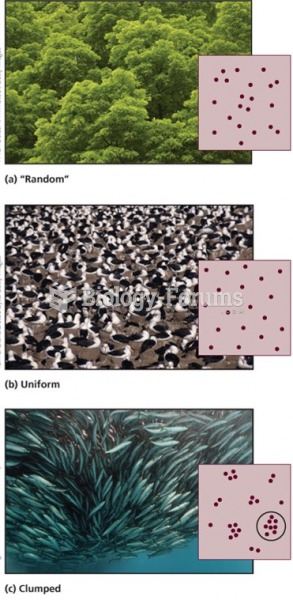 Population distribution (dispersion)
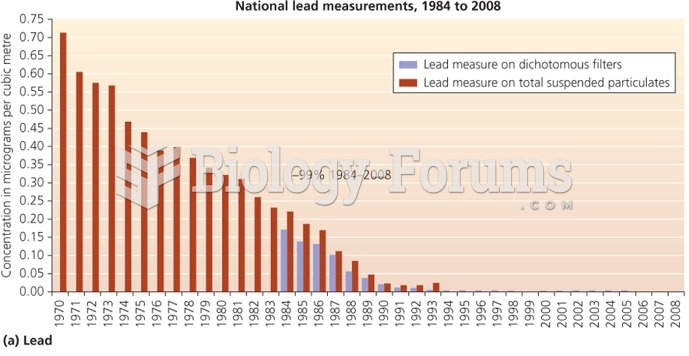 National lead measurements, 1984 - 2008