This topic contains a solution. Click here to go to the answer
|
|
|

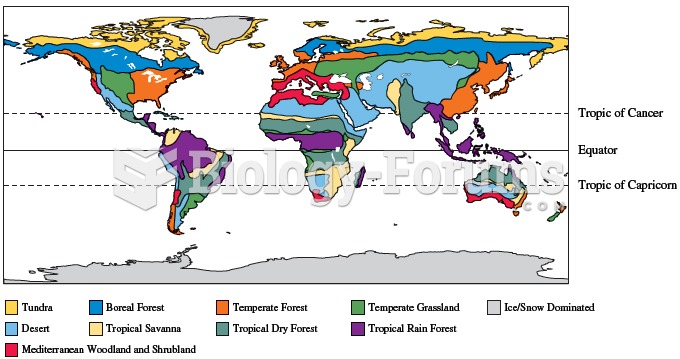 Variation in climatic conditions result in geographic variation in the distribution of biome types a
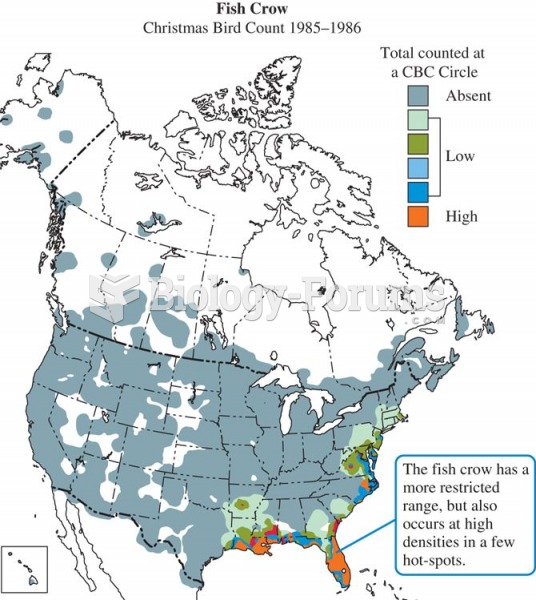 Winter distribution of the American crow, Corvus brachyrynchos.
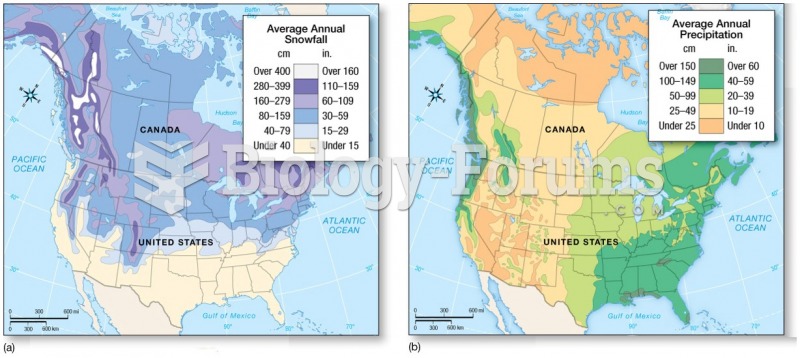 Distribution and Forms of Precipitation: Snow
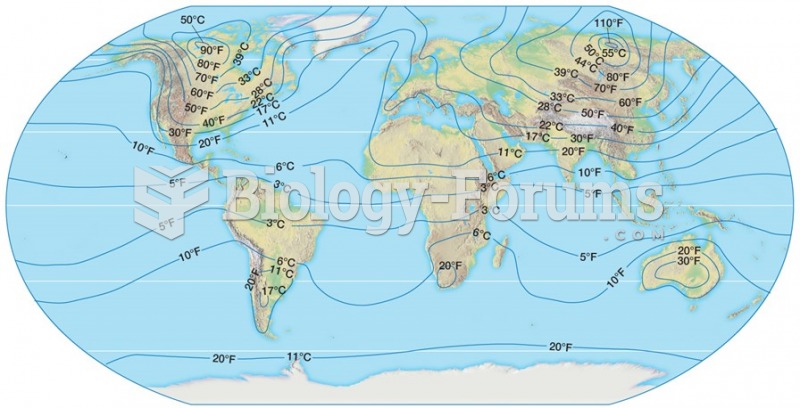 World Distribution of Temperature
 The Frequency Distribution Curve of a Drug
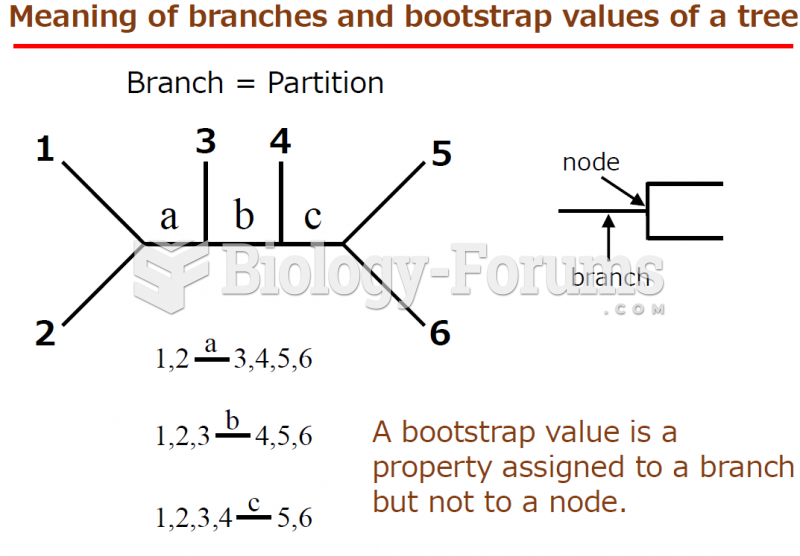 How to calculate the gain and loss gene numbers with low bootstrap of phylogenetic tree?