This topic contains a solution. Click here to go to the answer
|
|
|

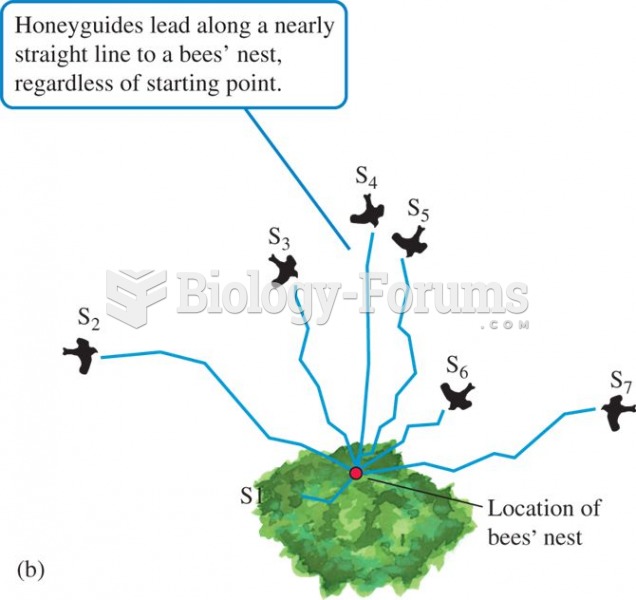 Paths taken by honeyguides leading people to bees' nests
 HIV-positive men with a high number of life stressors progress more quickly to AIDS than those with ...
 In old age, as in all other stages of the life course, people find life more pleasant if they have ...
 Shania Twain - You're Still The One (Official Music Video)
 Sensory Crossover Device for Visually Impaired People
 Find the factor demand for labour and the amount of output it will produce. Show all ...