This topic contains a solution. Click here to go to the answer
|
|
|

 The two bright stars are (left) Alpha Centauri and (right) Beta Centauri.
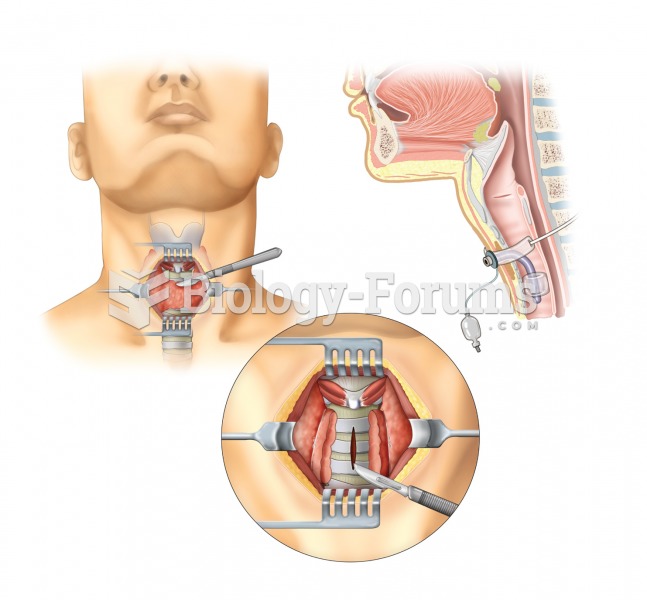 Tracheostomy. A tracheotomy, or incision into the trachea, is performed to create an opening into th
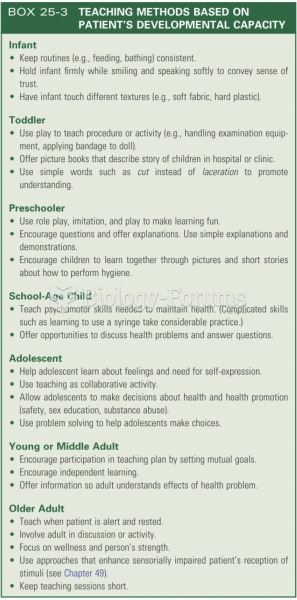 Teaching methods based on patients developmental capacity
 Three days after the Boston Marathon explosion, the FBI released this photograph that had been taken
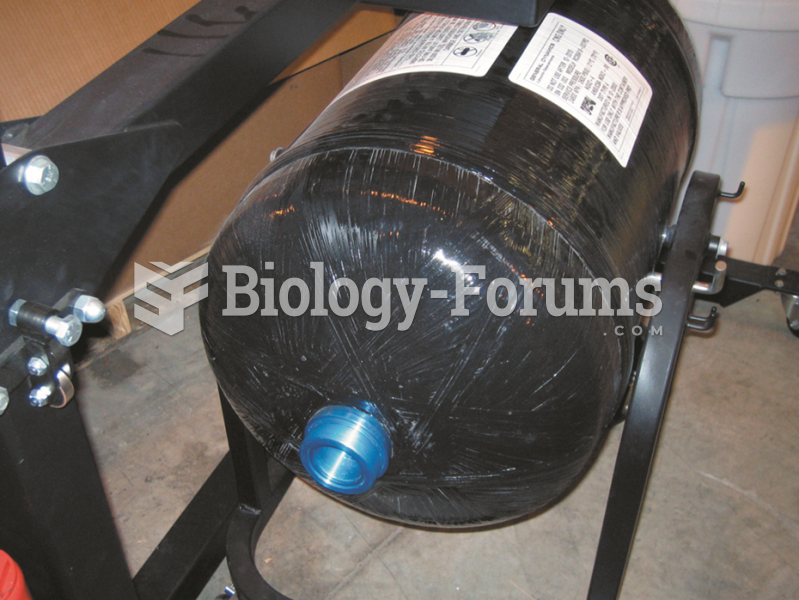 A CNG storage tank from a Honda Civic GX shown with the fixture used to support it while it is being ...
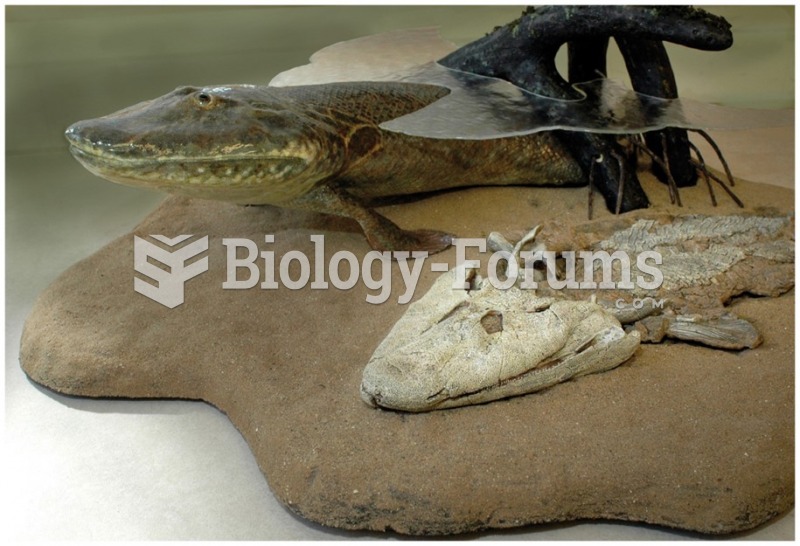 A recently discovered fossil of a missing evolutionary link is shown on the right, and a ...