Answer to Question 1
The independent variable produces a change in the dependent variable. The
dependent variable is, therefore, referred to as a function of the independent variable.
Answer to Question 2
The following is one method for choosing
convenient spacing. First, examine the data and determine the maximum values to be
plotted on each axis. Next, determine how many divisions are needed so that the
maximum value for each variable will fit on the graph. There are 10 divisions per
inch on each axis, so choose spacing that will make each division an even number.
This will make interpolation easier.
Answer to Question 3
a

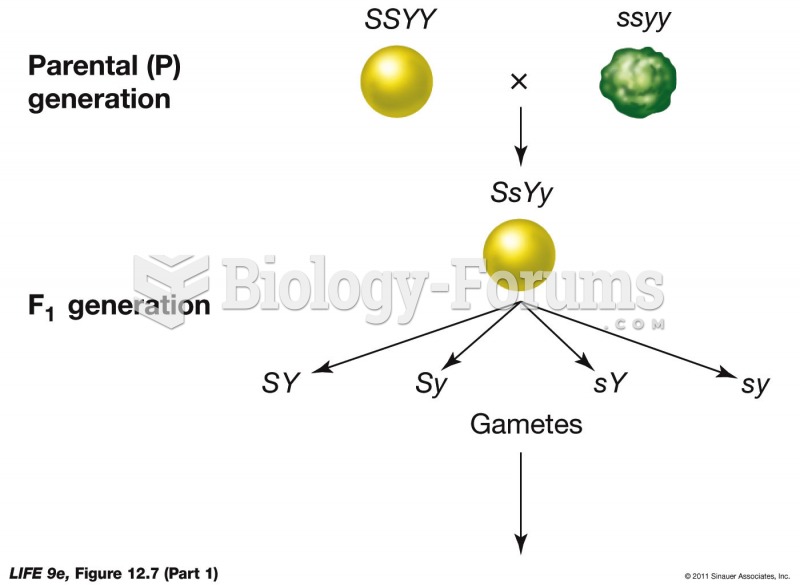
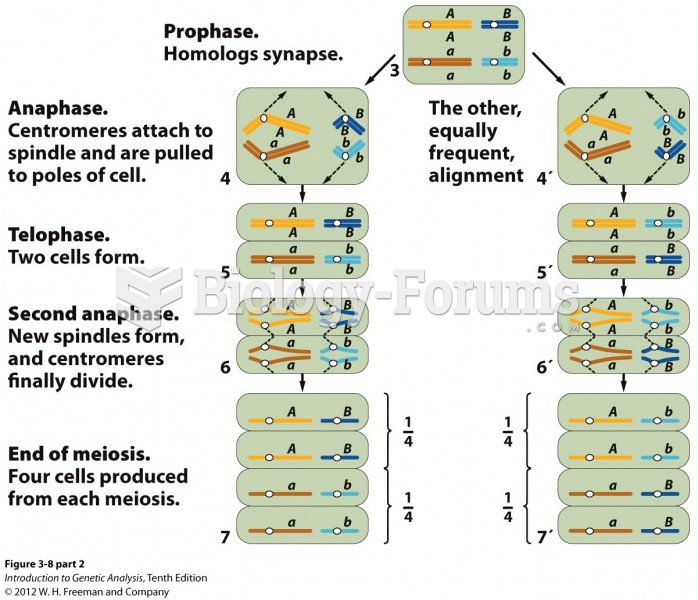 Independent assortment of chromosomes at meiosis explains Mendel’s ratio
 Independent Assortment p1
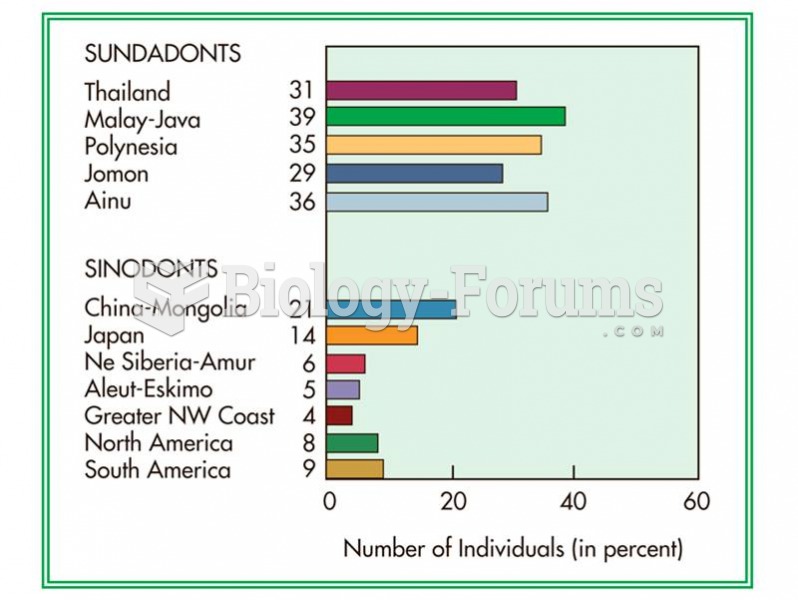 Number of lower molar cusps is one of the features used to distinguish sundadonts from sinodonts.
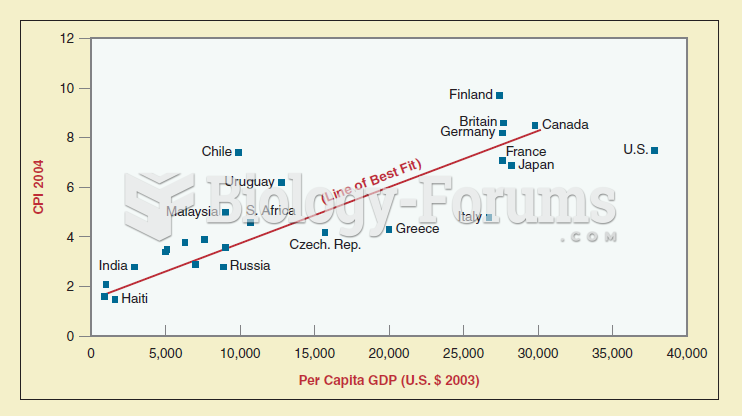 Scattergrams are a mechanism used by political scientists to show patterns and relationships among v
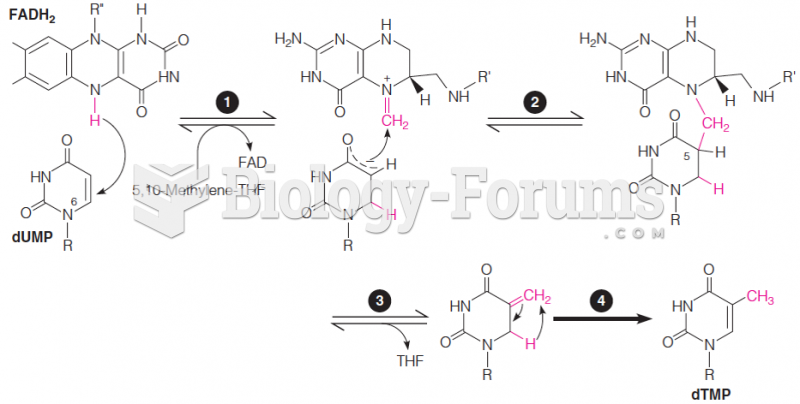 Proposed mechanism for the reaction catalyzed by flavin-dependent thymidylate synthase
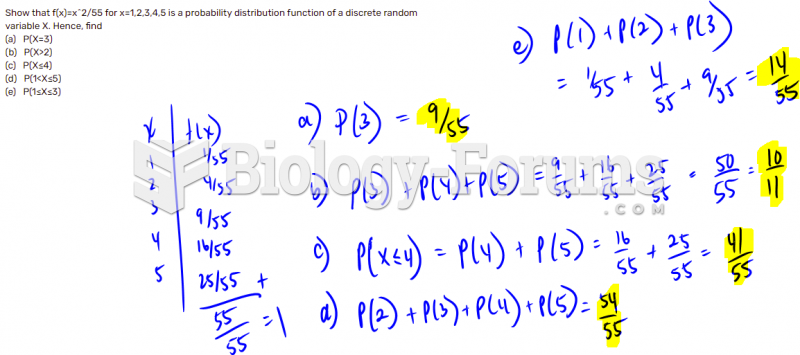 Discrete random variables- Probability Distribution Function