This topic contains a solution. Click here to go to the answer
|
|
|

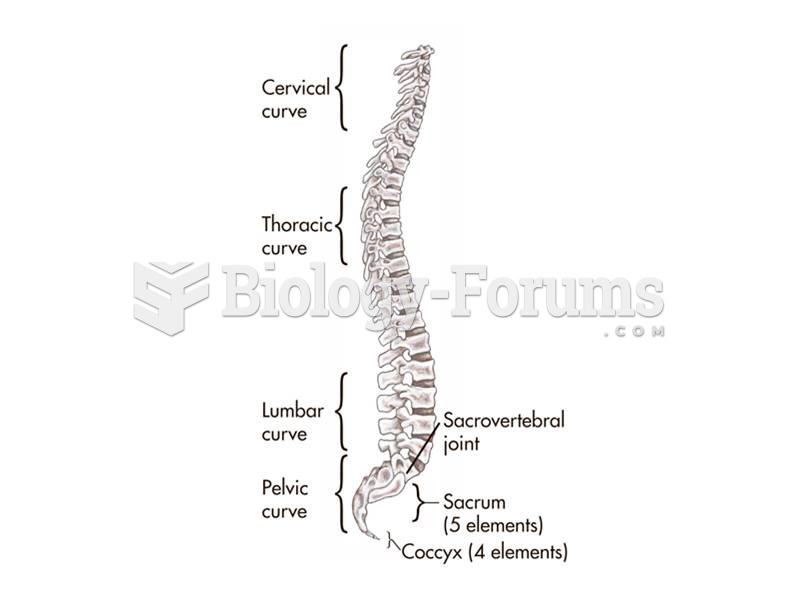 The S-curve in the human vertebral column--a result of the evolution of bipedality--makes humans hig
 Place sheet or towel over area to be heated. Use sufficient heat barrier for the heat source used. ...
 How to find the area of composite figures (Part 2)
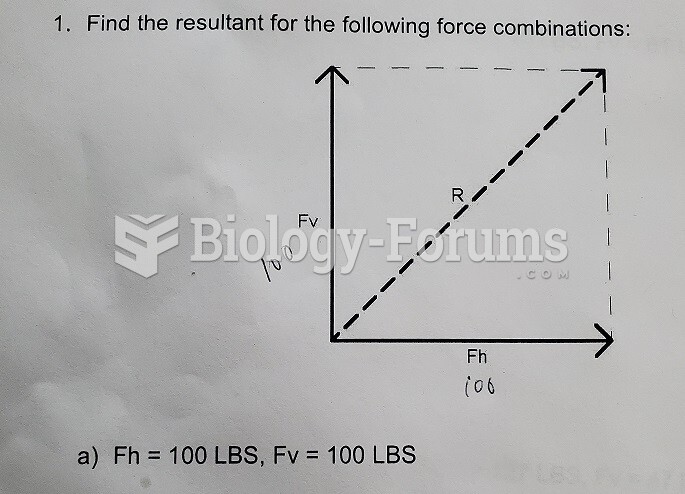 finding resultant for the following force combinations
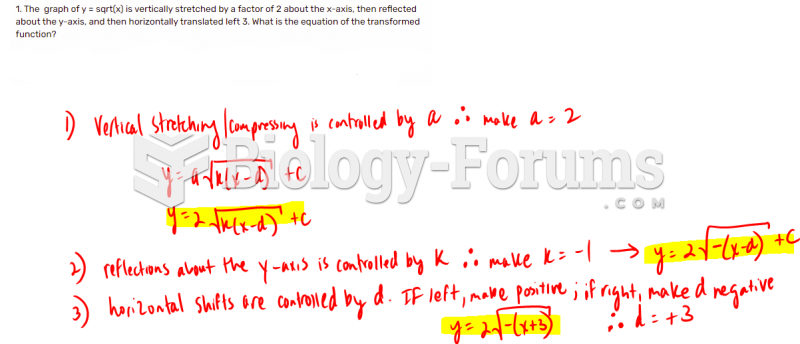 The graph of y = sqrt(x) is vertically stretched by a factor
 A graphical representation of correlations in IQ measurements in different sets of individuals. The