This topic contains a solution. Click here to go to the answer
|
|
|

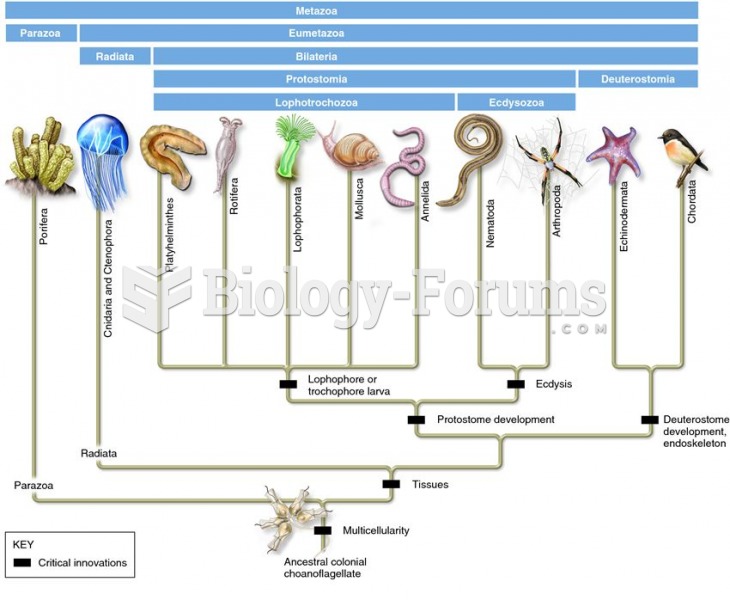 A revised animal phylogeny based on molecular data of SSU rRNA
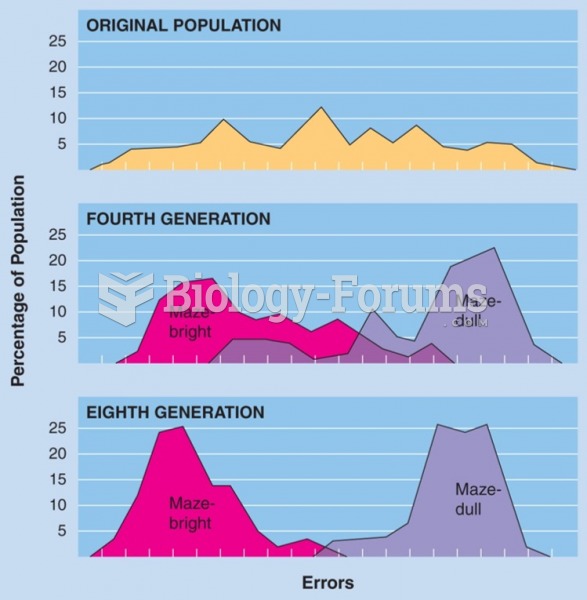 Selective breeding of maze-bright and maze-dull strains of rats by Tryon (1934). (Data from Cooper, ...
 Demographic Data for Nigeria
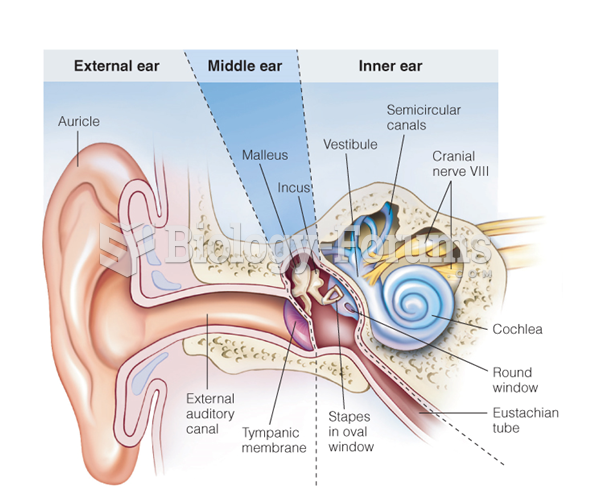 Structural of external, middle and inner ear
 Finding the derivative using the power rule - Solutions
 Finding derivatives of Trig Functions - pt 7