This topic contains a solution. Click here to go to the answer
|
|
|

 A melanistic jaguar is a colour morph which occurs at about 6% frequency in populations.
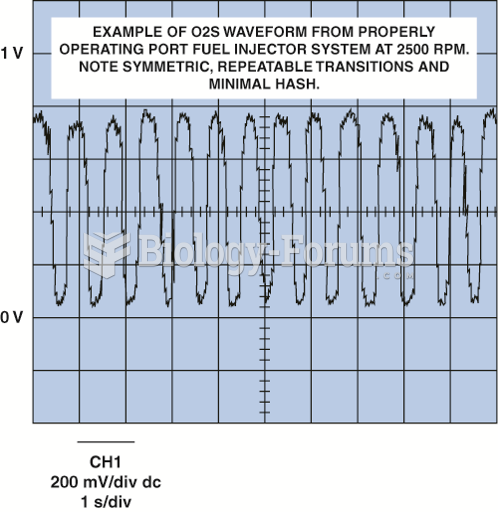 Normal oxygen sensor frequency is from about one to five times per second.
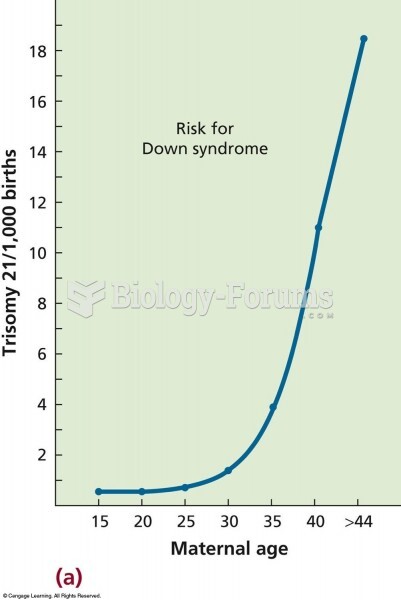 The relationship between maternal age and the frequency of trisomy 21 (Down syndrome). The risk incr
 If the frequency equals 60 Hz in Figure 10-1, what is the value of capacitance?
 The forked-line method for determining gamete genotype frequency
 Distributions and variance