This topic contains a solution. Click here to go to the answer
|
|
|

 Clinal maps of ABO allele distributions in the indigenous populations of the world.
 A sphere represented by means of modeling.
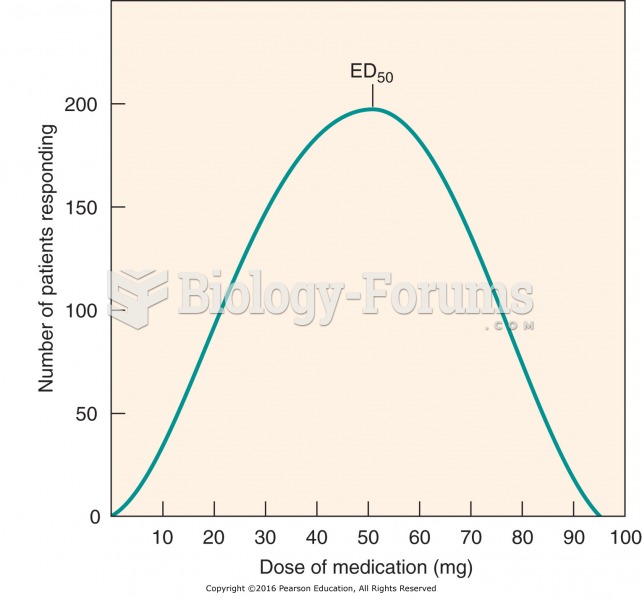 Frequency distribution curve: interpatient variability in drug response.
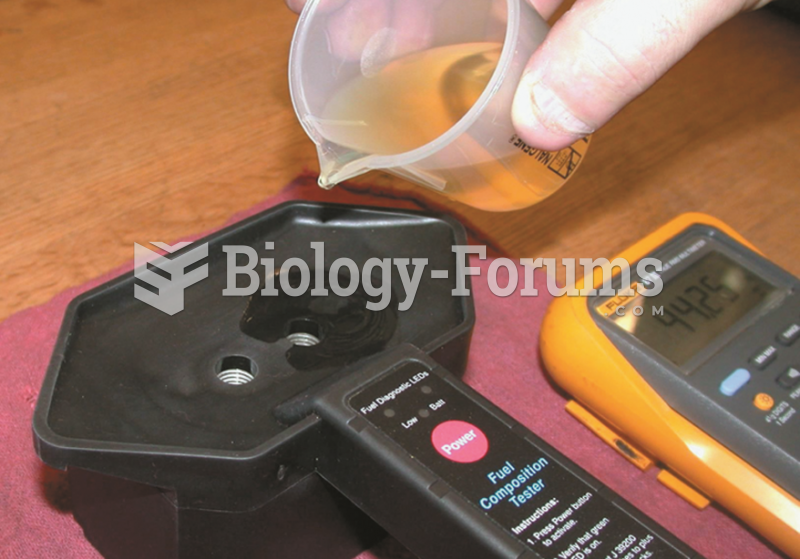 After verifying that the tester is capable of correctly reading the air frequency, gasoline is ...
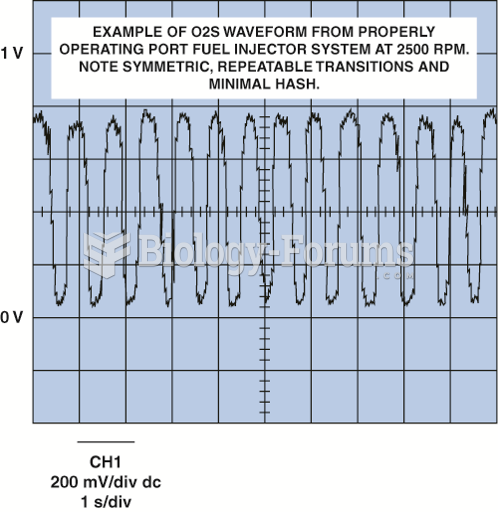 Normal oxygen sensor frequency is from about one to five times per second.
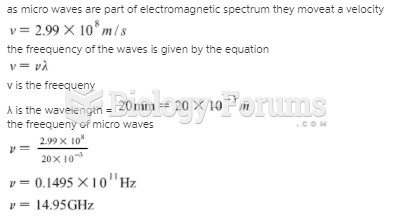 What is the frequency of 20-mm microwaves? (c = 3.0 × 10⁸ m/s) A) 100 MHzB) 400 MHzC) 15 GHzD) ...