This topic contains a solution. Click here to go to the answer
|
|
|

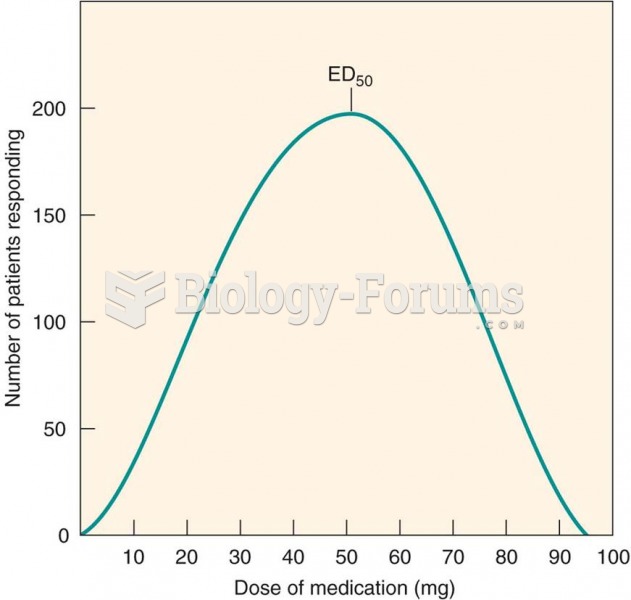 Frequency distribution curve: interpatient variability in drug response
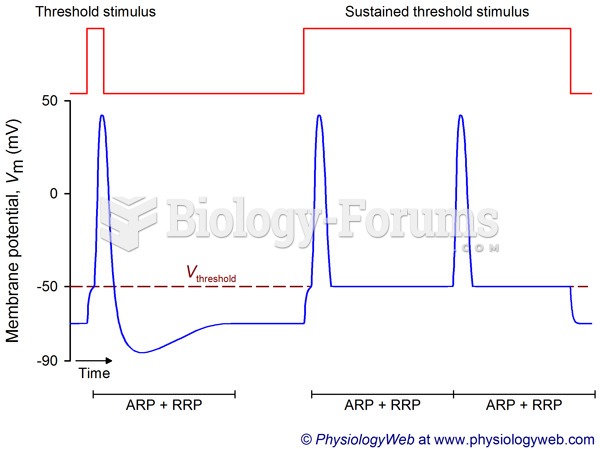 Frequency coding in the nervous system: Threshold stimulus.
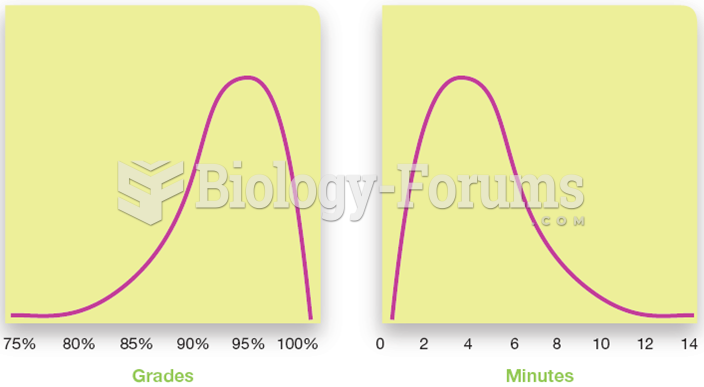 Skewed Distributions
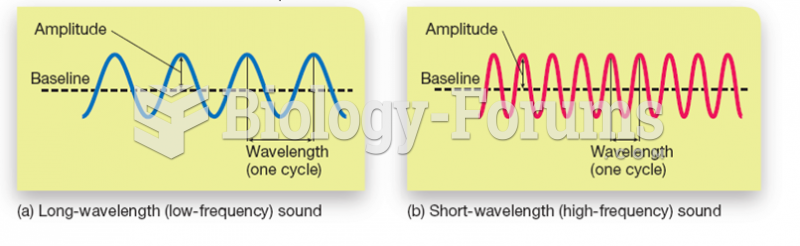 Characteristics of Sound: Frequency and Amplitude
 How to calculate the mean for grouped data
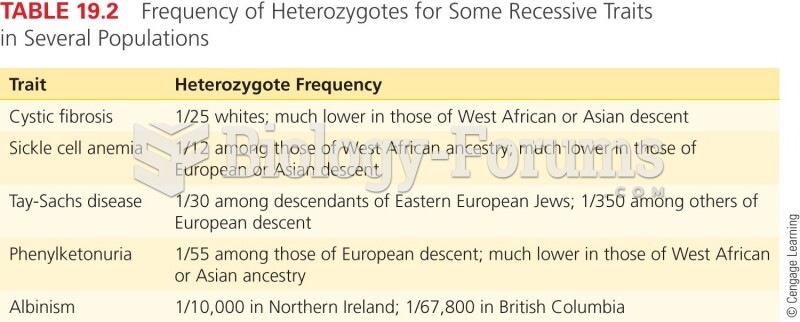 Frequency of Heterozygotes for Some Recessive Traits in Several Populations