This topic contains a solution. Click here to go to the answer
|
|
|

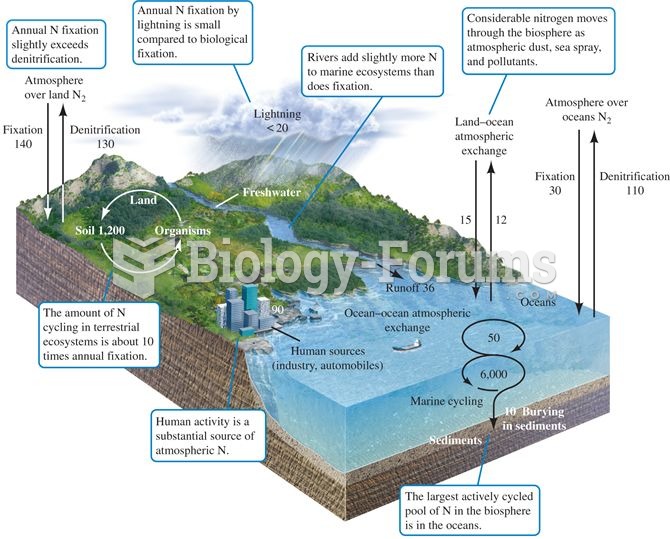 The nitrogen cycle. Numbers represent fluxes as 1012 g N per year (data from Schlesinger 1991, after
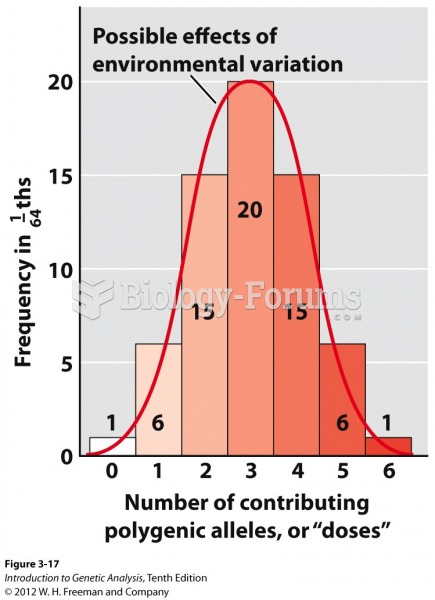 Histogram of polygenes from a trihybrid self
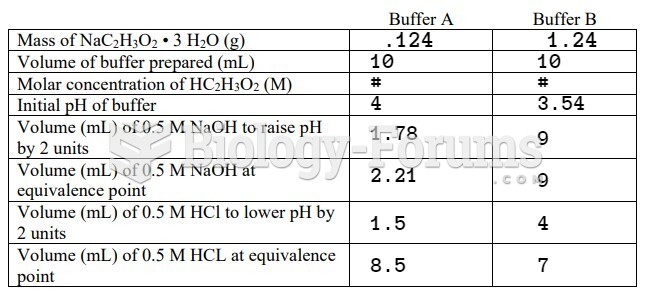
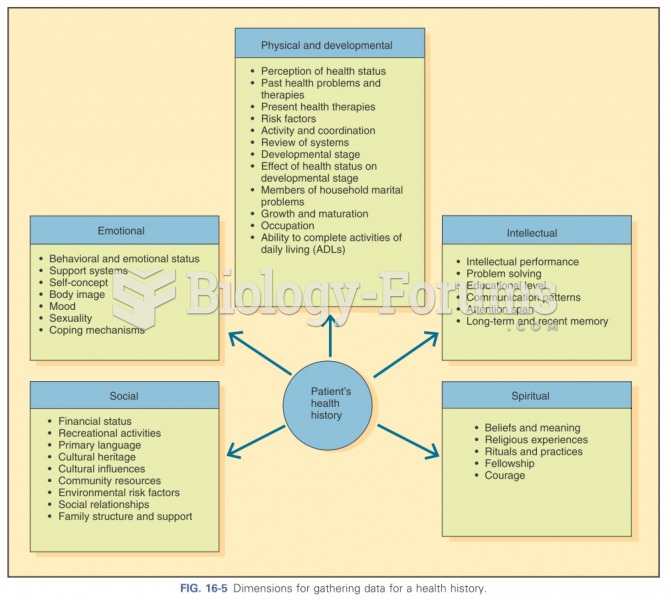 Dimensions for gathering data
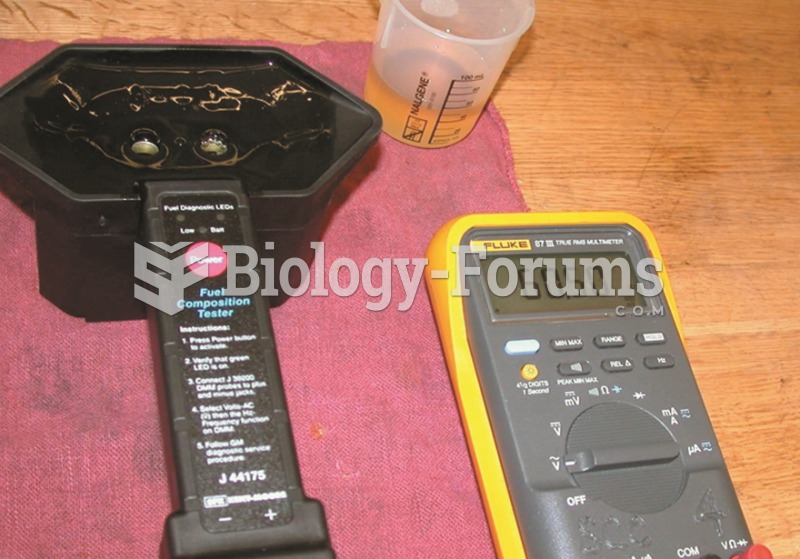 Record the AC frequency as shown on the meter and subtract 50 from the reading (e.g., 60.50 -50.00 = ...
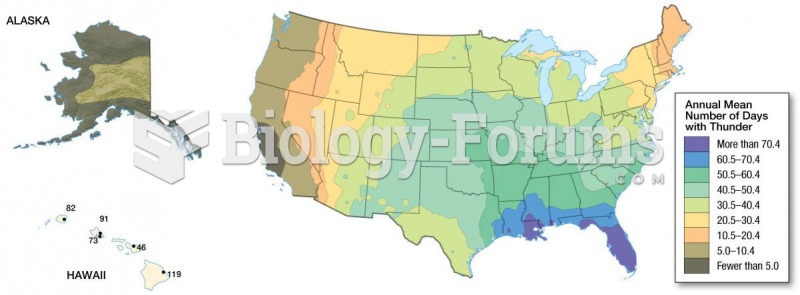 Distribution of Thunderstorms: Detailed data on cloud-to-ground lightning flashes have been ...
 data
data