This topic contains a solution. Click here to go to the answer
|
|
|

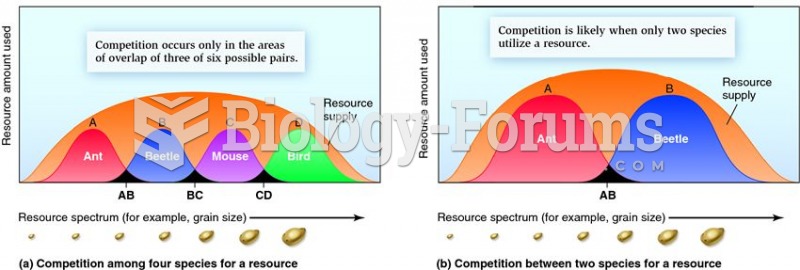 The frequency of competition according to the number of species involved.
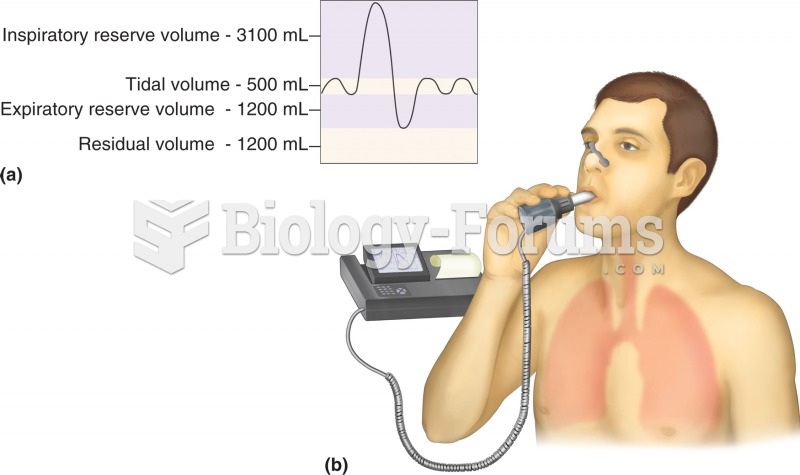 Pulmonary function test: spirometry. (a) Normal respiratory volumes, as measured during spirometry.
 Organization of Spatial Frequency
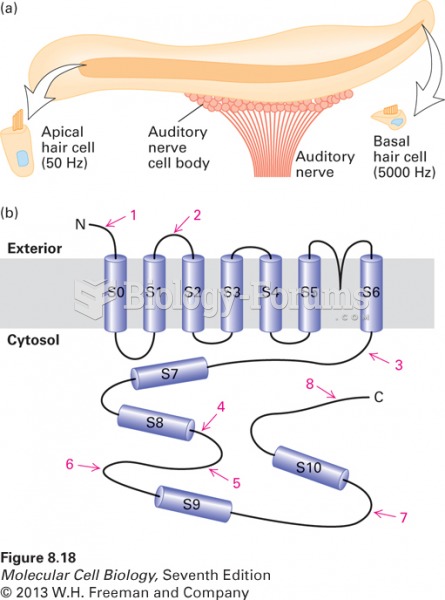 Role of alternative splicing in the perception of sounds of different frequency
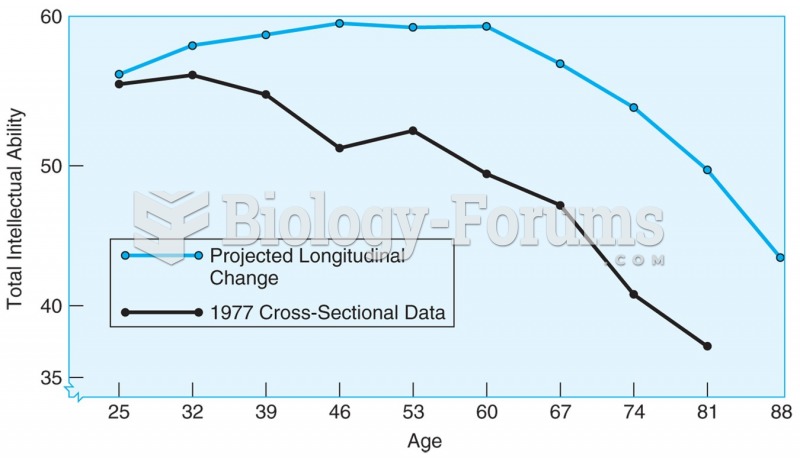 4.1 Age changes in total IQ based on cross-sectional data (lower line) and longitudinal data ...
 A(n) _____ is a spur-of-the-moment question. Fill in the blank(s) with correct word