This topic contains a solution. Click here to go to the answer
|
|
|

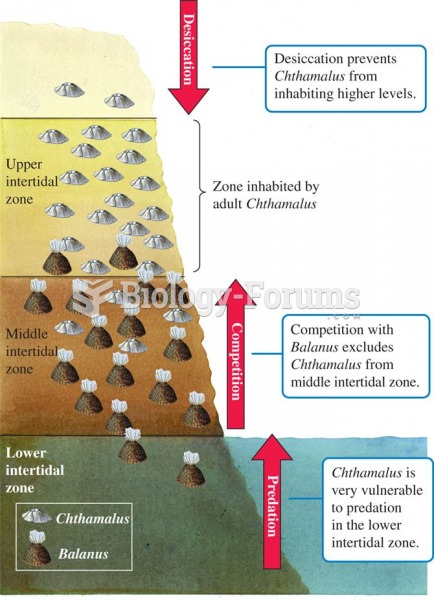 Environmental factors restricting the distribution of Chthamalus to the upper intertidal zone.
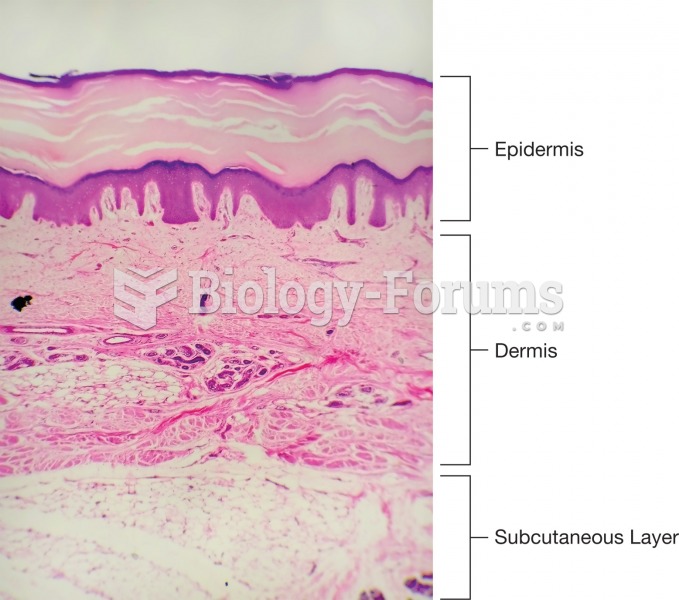 Photomicro graph showing the three layers of the skin.
 A health history is essential in collecting subjective data about metabolic acidosis.
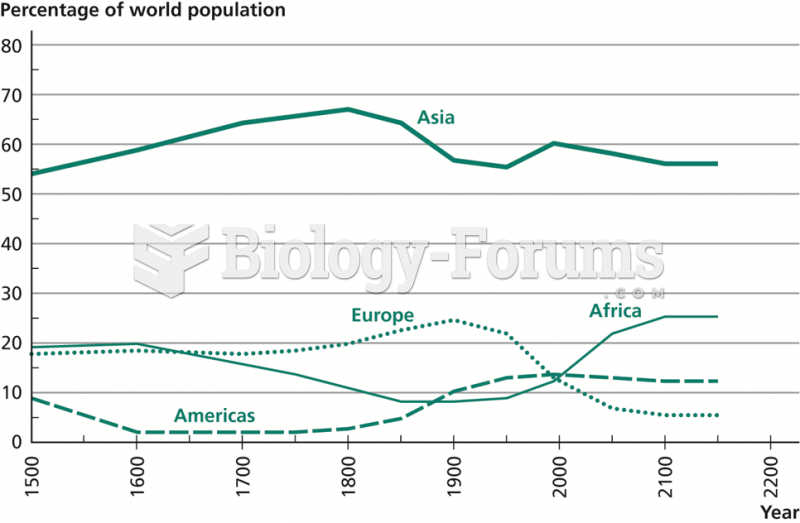 Distribution of the World’s Population
 What is the frequency of 20-mm microwaves? (c = 3.0 × 10⁸ m/s) A) 100 MHzB) 400 MHzC) 15 GHzD) ...
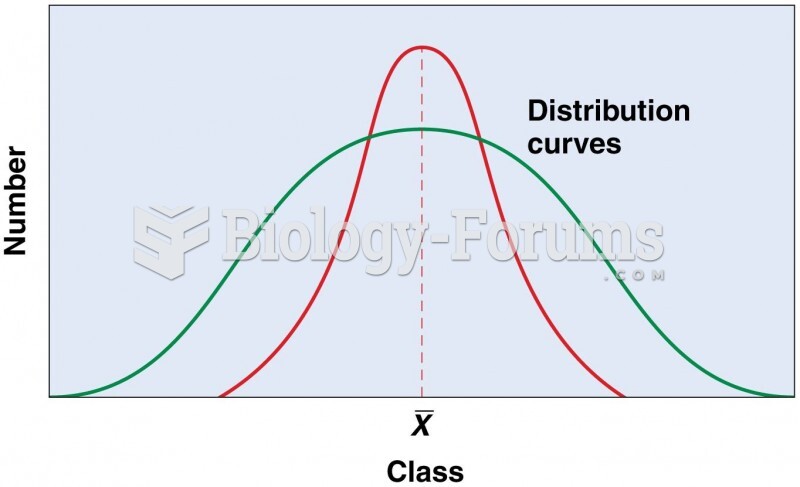 Two normal frequency distributions with the same mean but different amounts of variation