This topic contains a solution. Click here to go to the answer
|
|
|

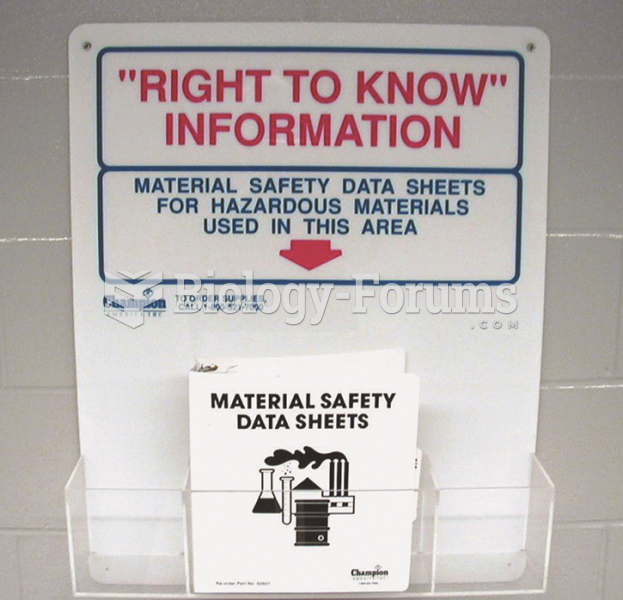 Material safety data sheets (MSDS), now called safety data sheets (SDS), should be readily available ...
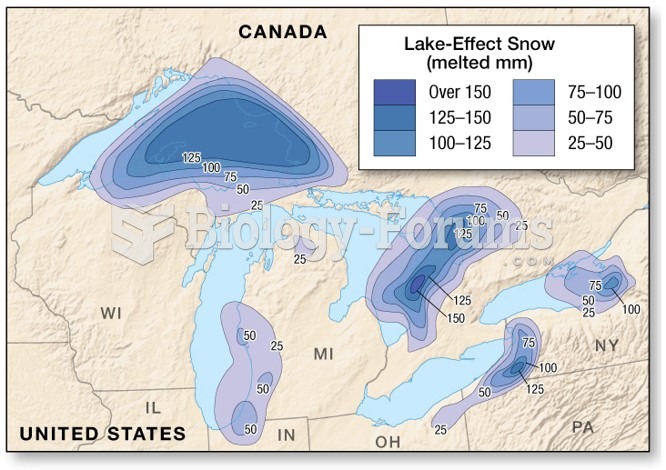 Distribution and Forms of Precipitation: Snow
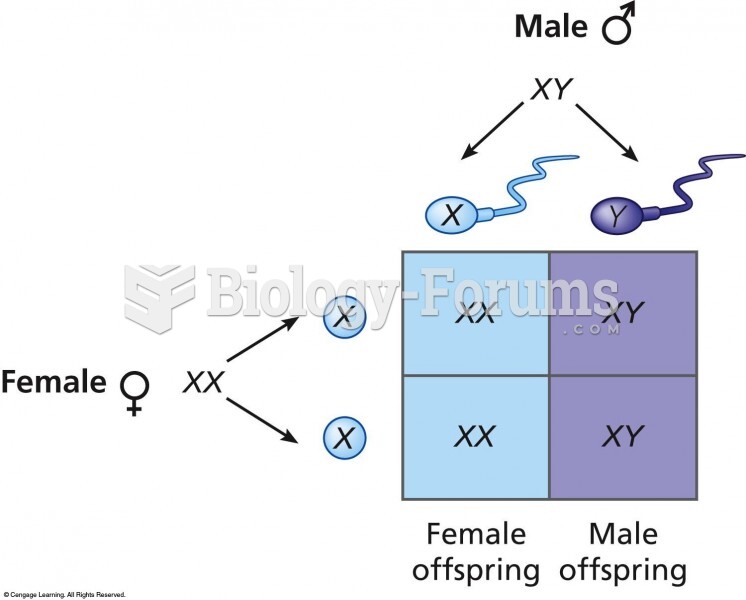 Distribution of sex chromosomes from generation to generation. All children receive an X chromosome
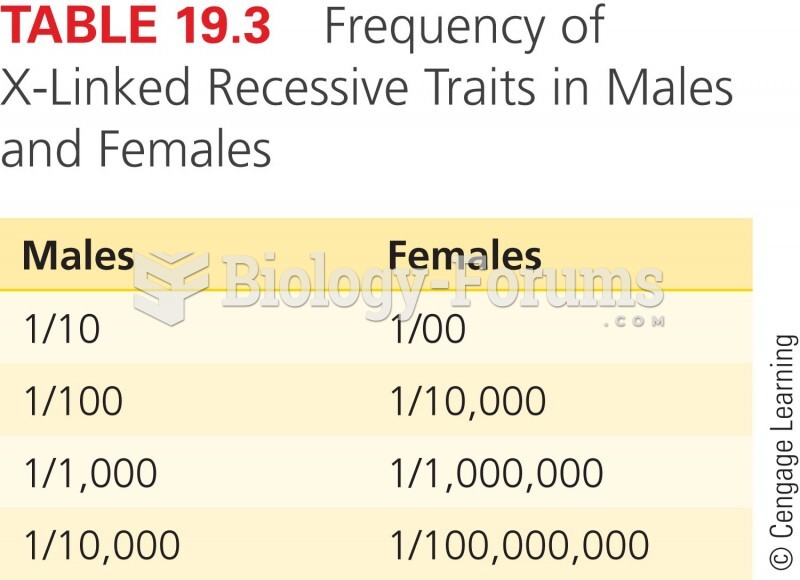 Frequency of X-Linked Recessive Traits in Males and Females
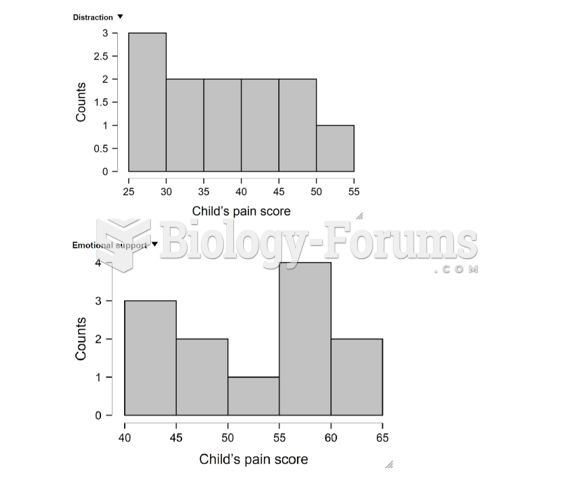 Histogram
 Change in the frequency of a lethal recessive allele, a