This topic contains a solution. Click here to go to the answer
|
|
|

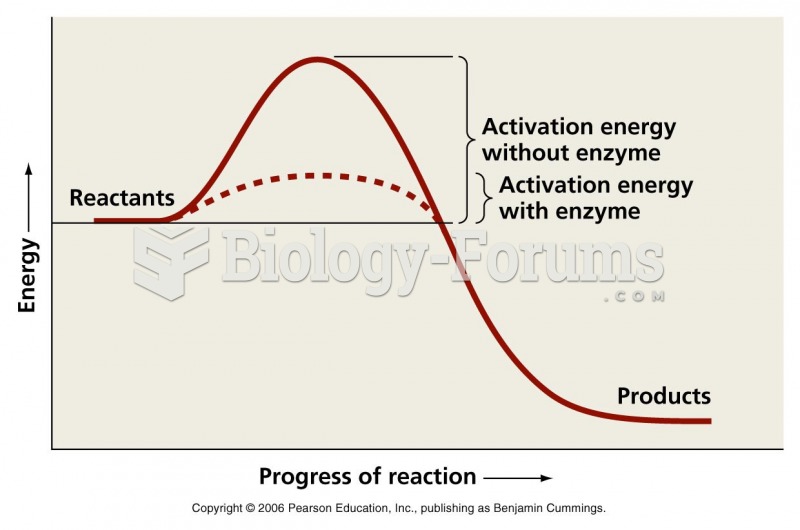 Activation energy graph
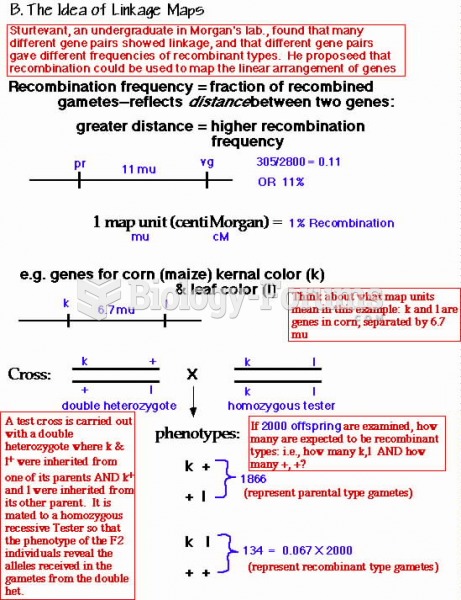 recombination frequency
 For millions of people, the United States represents a land of opportunity and freedom from ...
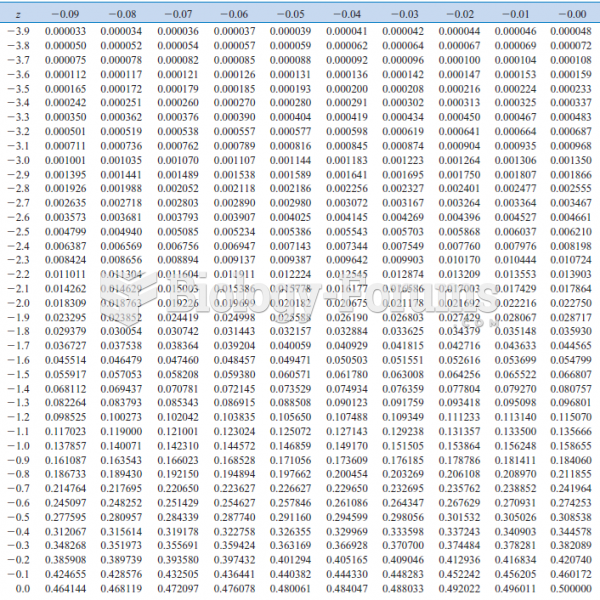 Cumulative Standard Normal Distribution
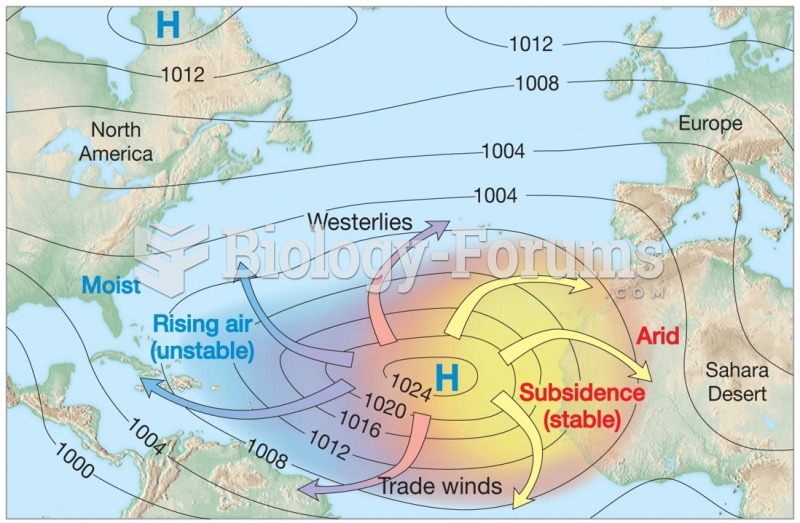 Distribution of precipitation over the continents
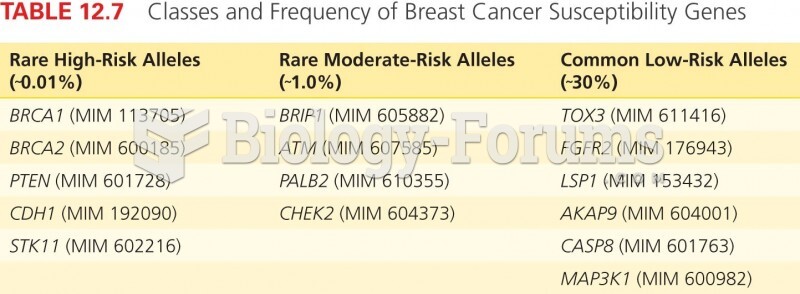 Classes and Frequency of Breast Cancer Susceptibility Genes