This topic contains a solution. Click here to go to the answer
|
|
|

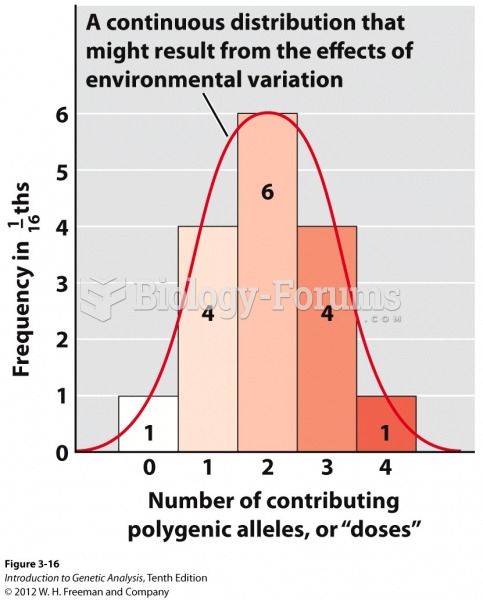 Histogram of polygenes from a dihybrid self
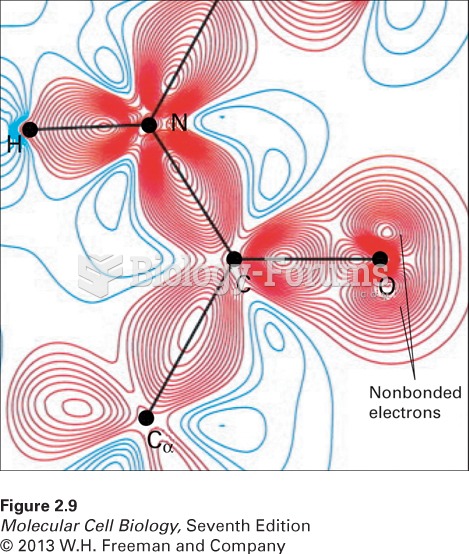 Distribution of bonding and outer nonbonding electrons in the peptide group
 For millions of people, the United States represents a land of opportunity and freedom from ...
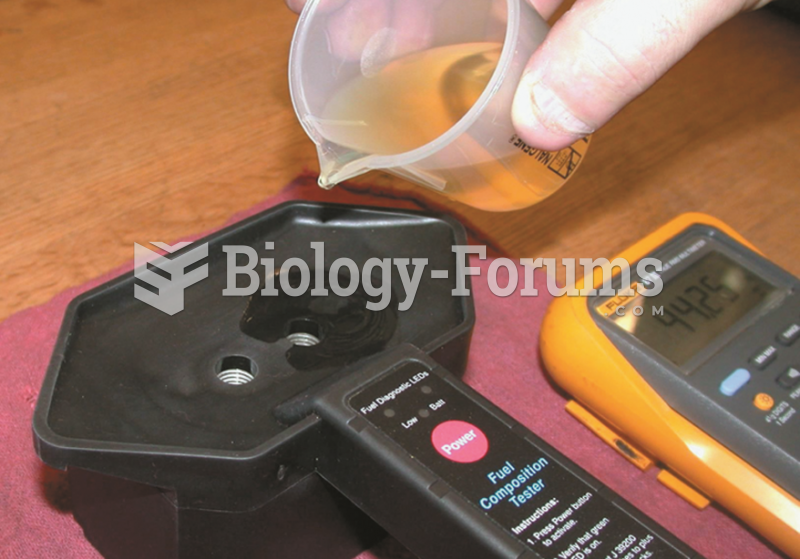 After verifying that the tester is capable of correctly reading the air frequency, gasoline is ...
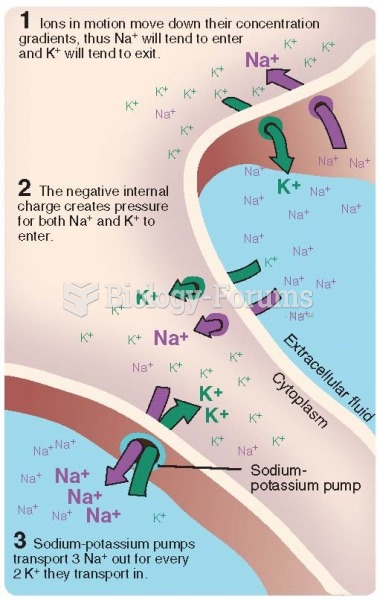 Three factors that influence the distribution of Na+ and K+ ions across the neural membrane.
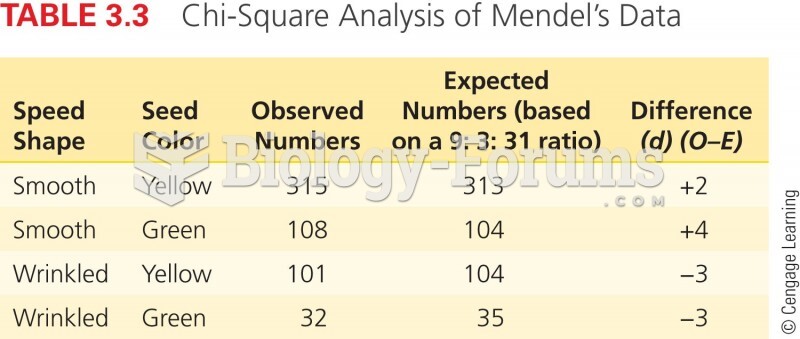 Chi-Square Analysis of Mendel's Data